Nicolas Kruchten
is a data visualization specialist
based in Montreal, Canada.
Tools
I have built or contributed to a number of software tools, mostly for data visualization, analysis or management.
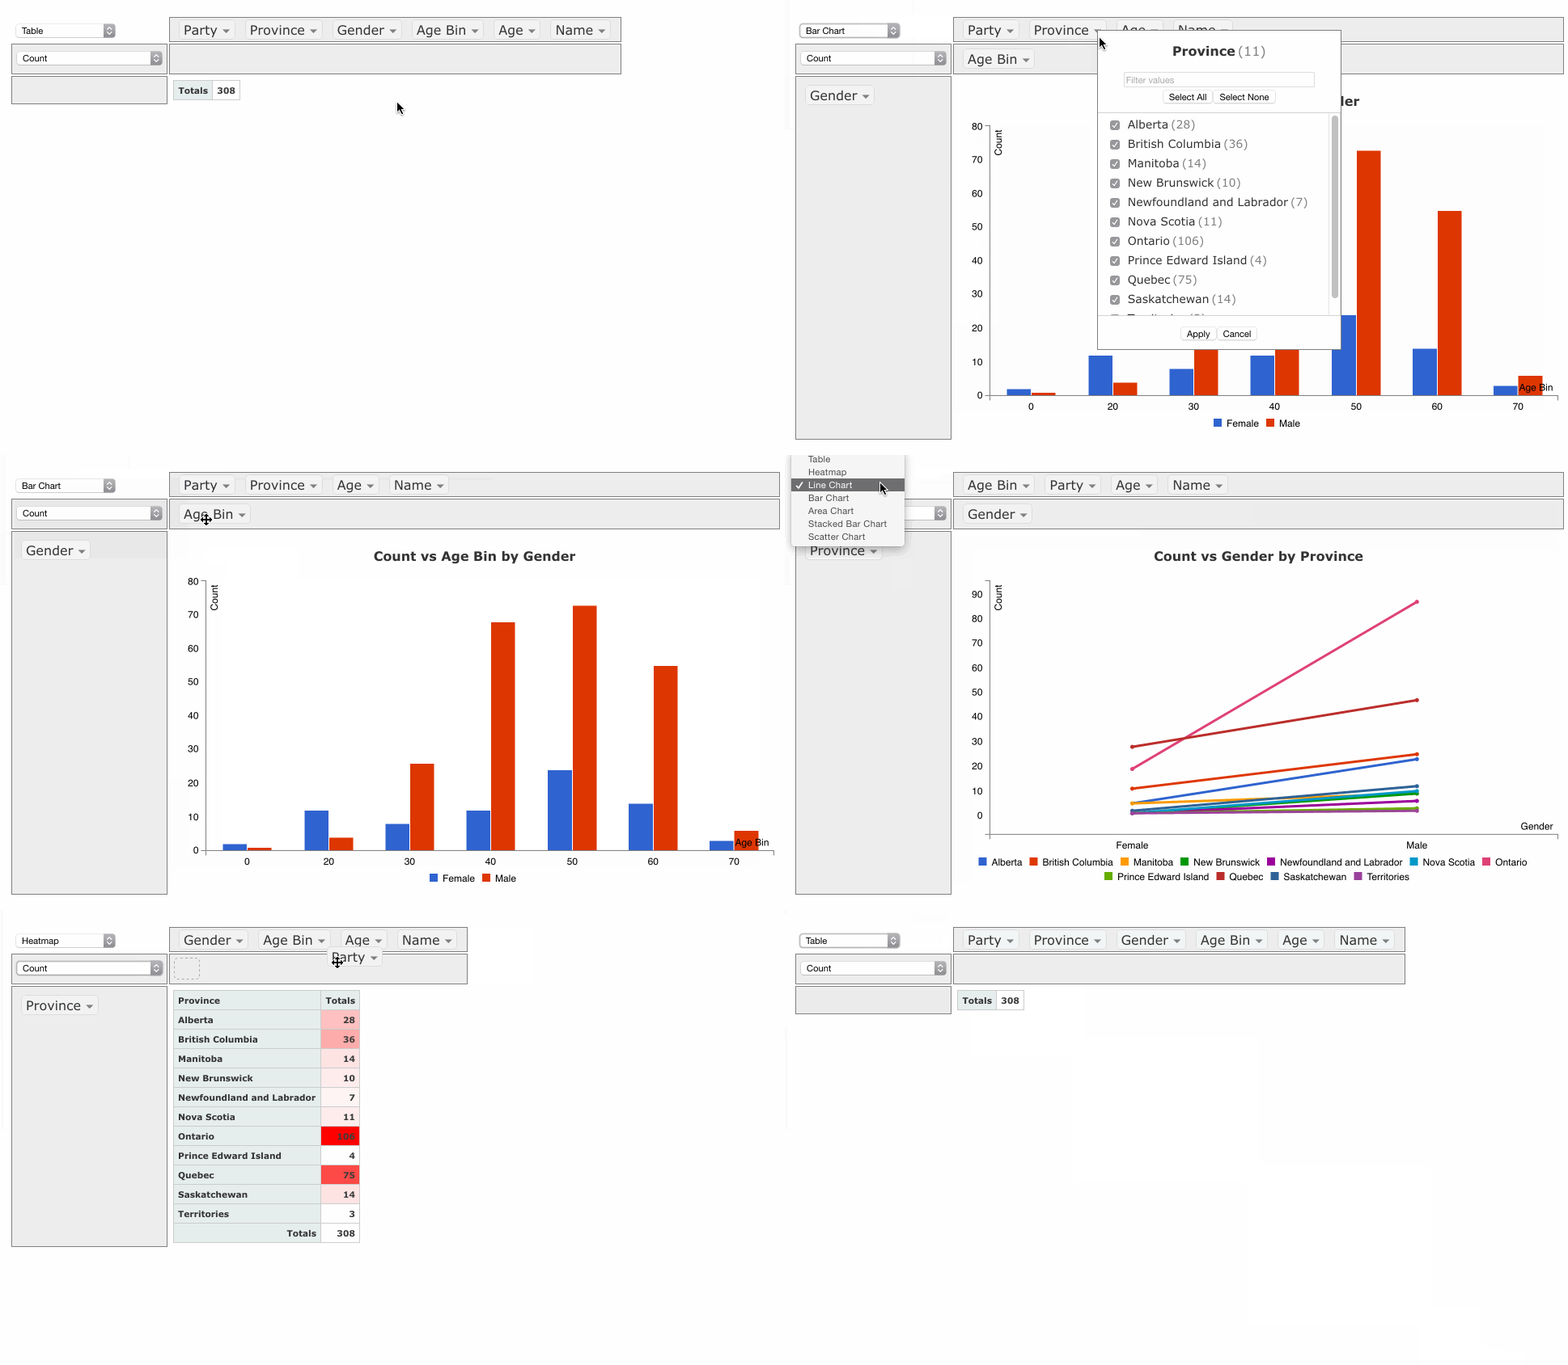
Drag'n'Drop Pivot Tables and Charts, in Jupyter/IPython Notebook
PivotTable.js is a Javascript Pivot Table and Pivot Chart library with drag’n’drop interactivity, and it can now be used with Jupyter/IPython Notebook via the pivottablejs module. This has been possible for RStudio users for a while now via rPivotTable, but why should they have all the fun?
Montreal Python: Introducing the Machine Learning Database
I recently did the first ever public demo of the product I'm working on at Datacratic: the Machine Learning Database.
PivotTable.js
When I wear my 'data scientist hat', one of the tools I reach for most often is a pivot table. When I wanted to build a web-based tool that included a pivot table, I didn't find any Javascript implementations that made sense or didn't have crazy assumptions built-in, so I rolled my own in CoffeeScript, as a jQuery plugin.
It's now up on GitHub under an MIT license with some nice examples. I hope people find it useful!
If you work with data and you don't know what a pivot table is, I encourage you to learn about them, because they are very useful for quick'n'dirty data analysis. My web-based implementation is a decent learning tool but there are other, much-better implementations, such as in Microsoft Excel (although since Office 2003 they've made some changes that were not for the better) and AquaDataStudio.
I posted this on Hacker News and got some nice comments!
Kernel Density Estimation and Analysis Tool
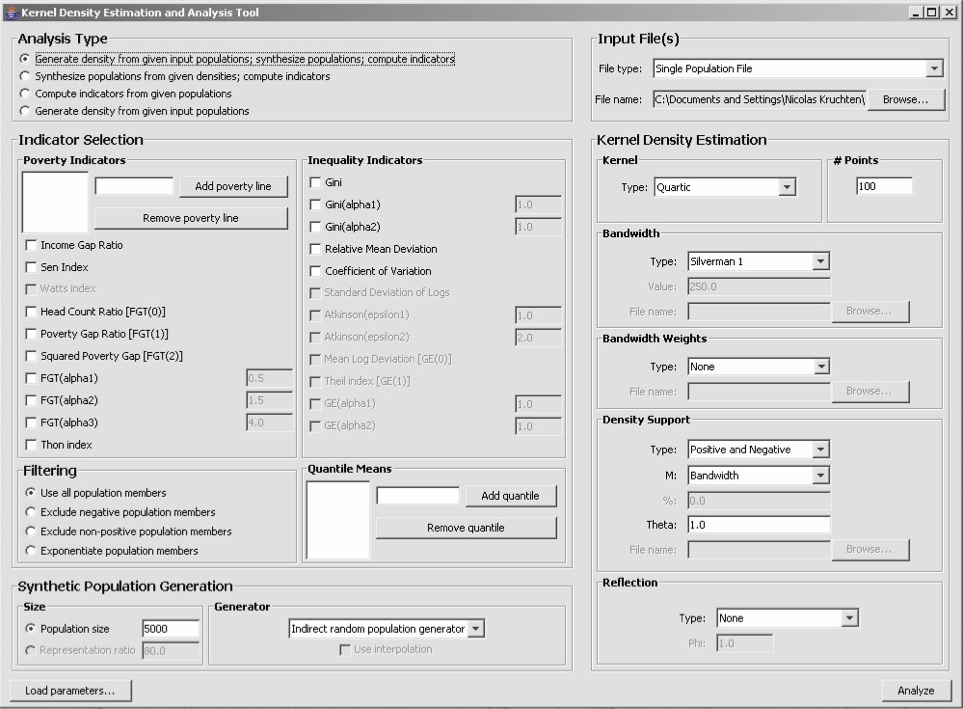
In 2005, I was contracted to create a program to support research into the application of a statistical technique called Kernel Density Estimation to the study of global poverty. The result of this contract (which I worked on with my friend and occasional colleague David de Koning) is the Kernel Density Estimation and Analysis tool which I have just released on Github under an open-source license.
The research (which, to be clear, wasn't done by me) resulted in a very interesting paper called Kernel Density Estimation Based on Grouped Data: The Case of Poverty Assessment.
Galapagos
In 2003, I wrote a neat and powerful piece of software called Galapagos for my 4th-year undergraduate thesis (download PDF). It was a framework for the development of advanced (i.e. distributed, parallel and/or hybrid) evolutionary algorithms, applicable to a wide range of computational challenging optimization problems. I applied it to a variety of transportation-related problems at the University of Toronto.
Volunteer Database for Santropol Roulant
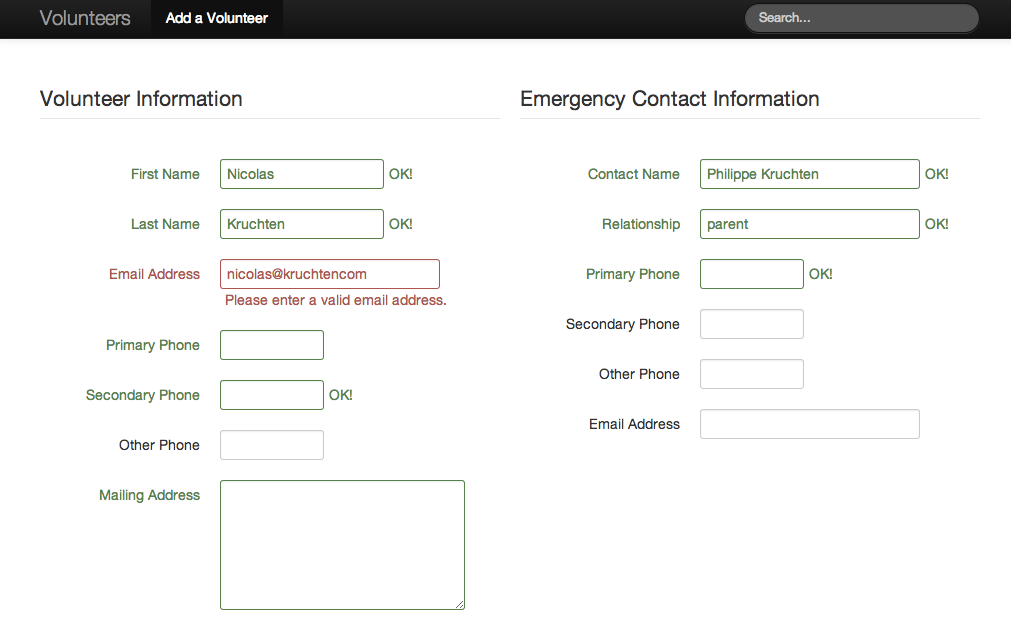
There’s an organization in Montreal I think is awesome called Santropol Roulant which, among other things, has a meals-on-wheels operation. They have hundreds of volunteers and wanted to upgrade the system they used to store their volunteer information, so I helped them out, and I’ve open-sourced the results, in case any other non-profit wants a very simple volunteer-list management system.
Statsd, Graphite and Nagios
At Datacratic we tend to worship, like Etsy (and AppNexus!), at the Church of Graphs. We've even started using Statsd, the system they've released to collect stats and relay them to Carbon for display in Graphite. And by display, I mean display on a dashboard visible to the entire dev team at the office, as seen above! Statsd is a very simple system to which you can send UDP messages about various stats you want to track, which it then aggregates and passes along to Carbon, which stores them in Whisper, Graphite's back-end data store. That's a lot of moving parts but it works very well. Sending stats to statsd is extremely easy from any language (we do it from Javascript and C++) and carries low overhead, which is key for the type of work we do.
OpenMyEWB
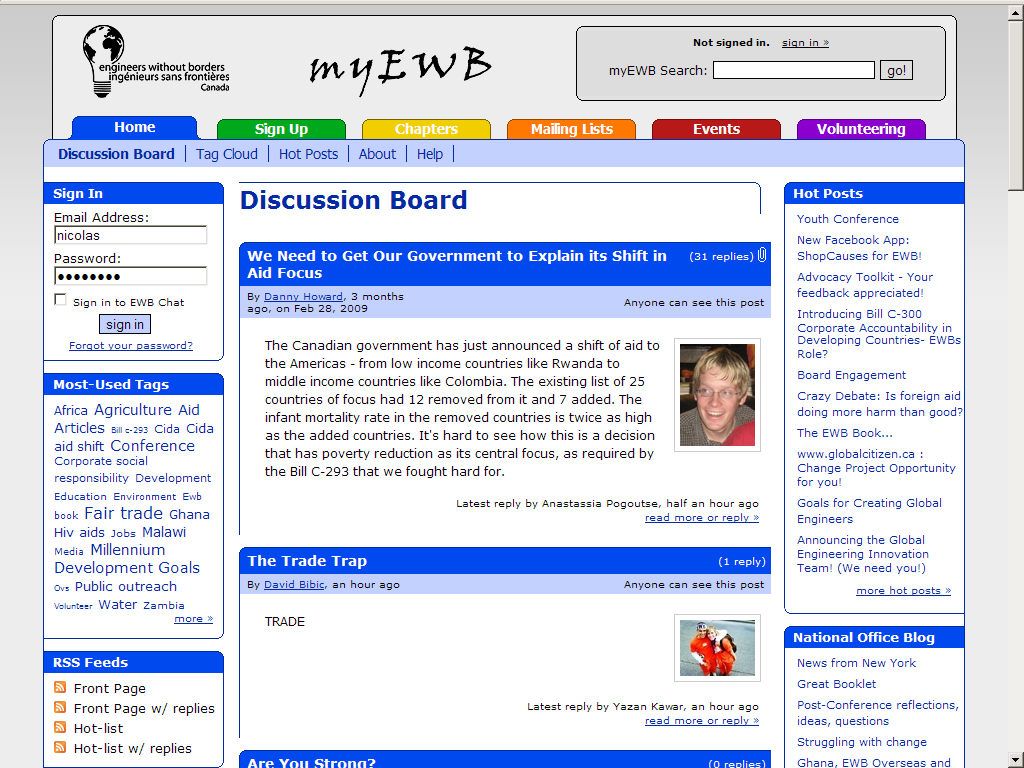
From October 2005 to May 2010, myEWB.ca was Engineers Without BordersCanada's official online community system. During that time, tens ofthousands of people used myEWB to participate in thousands of onlineconversations, send millions of emails, schedule hundreds of events,share files, apply to serve overseas, register for conferences, paytheir membership dues and otherwise collaboratively work towardseradicating poverty. As the team leader and major contributor to themyEWB project, I am proud to be able to host a small page for OpenMyEWB:the now-open-sourced software that powered myEWB.ca.
BitNorth 2009: myEWB
I did a 'short bit' presentation at Bitnorth 2009 about my feelings on myEWB and its history.
The presentation is available as PDF, PowerPoint and MP3.
PHPTab
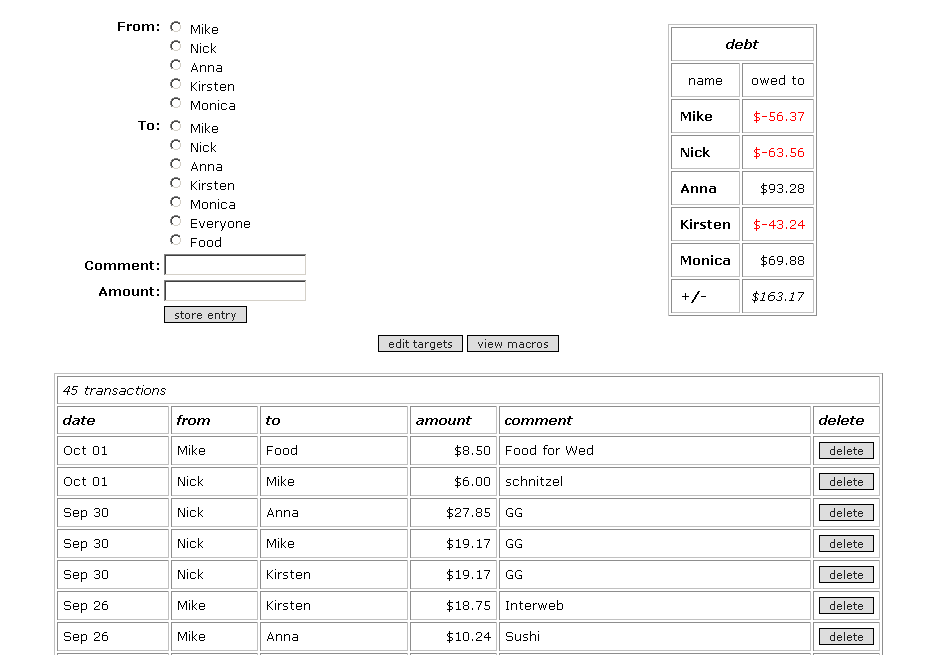
The Problem
You're part of a small-to-medium group of people who trust each otherand have some reason to spend time and money together (e.g. you have afew housemates or you work in a friendly office environment). It's ahuge hassle to constantly be requesting separate bills or lending eachother money and losing track of who owes who how much and for what. Youwaste time quibbling over small amounts and people in your group don'tlike lending each other money or picking up the tab for lunch.
The Solution
Using this simple web application, a group of people who trust eachother can keep a running tab of how much they owe each other. This ishandy for figuring out such things as who should pay for groceries nexttime (e.g. whoever owes the most) and generally makes people moreeasy-going about spotting each other money or picking up lunch, as theyknow they can keep track of it. With PHPTab, any member of your groupcan be as lenient or penny-counting as they want, without ever having toactually be constantly be trading small sums of money. It's just amatter of "putting it on their tab".
