
Nicolas Kruchten
is a data visualization specialist
based in Montreal, Canada.
Vibe CADing an Interactive Data Physicalization
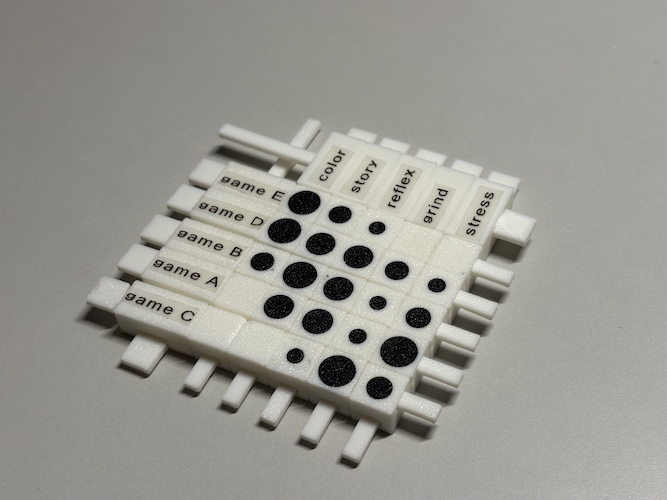
Ever since I bought a 3d printer, I’ve wanted to dip a toe into data physicalization. I’m not very good at point-and-click 3d modelling tools, and this is kind of a casual hobby rather than serious work so I used Claude Code, an AI programming assistant, to vibe code a parametric Python program to generate the printable files. It was a real rush to find out I can just start verbally describing the object I want to an AI agent and then be holding it in my hand less than three hours later! So here’s the story of how I vibe CADed my very own 1960s-inspired Bertin reorderable matrix.
Metrics for Reasoning About the Usability of Visualization Notations
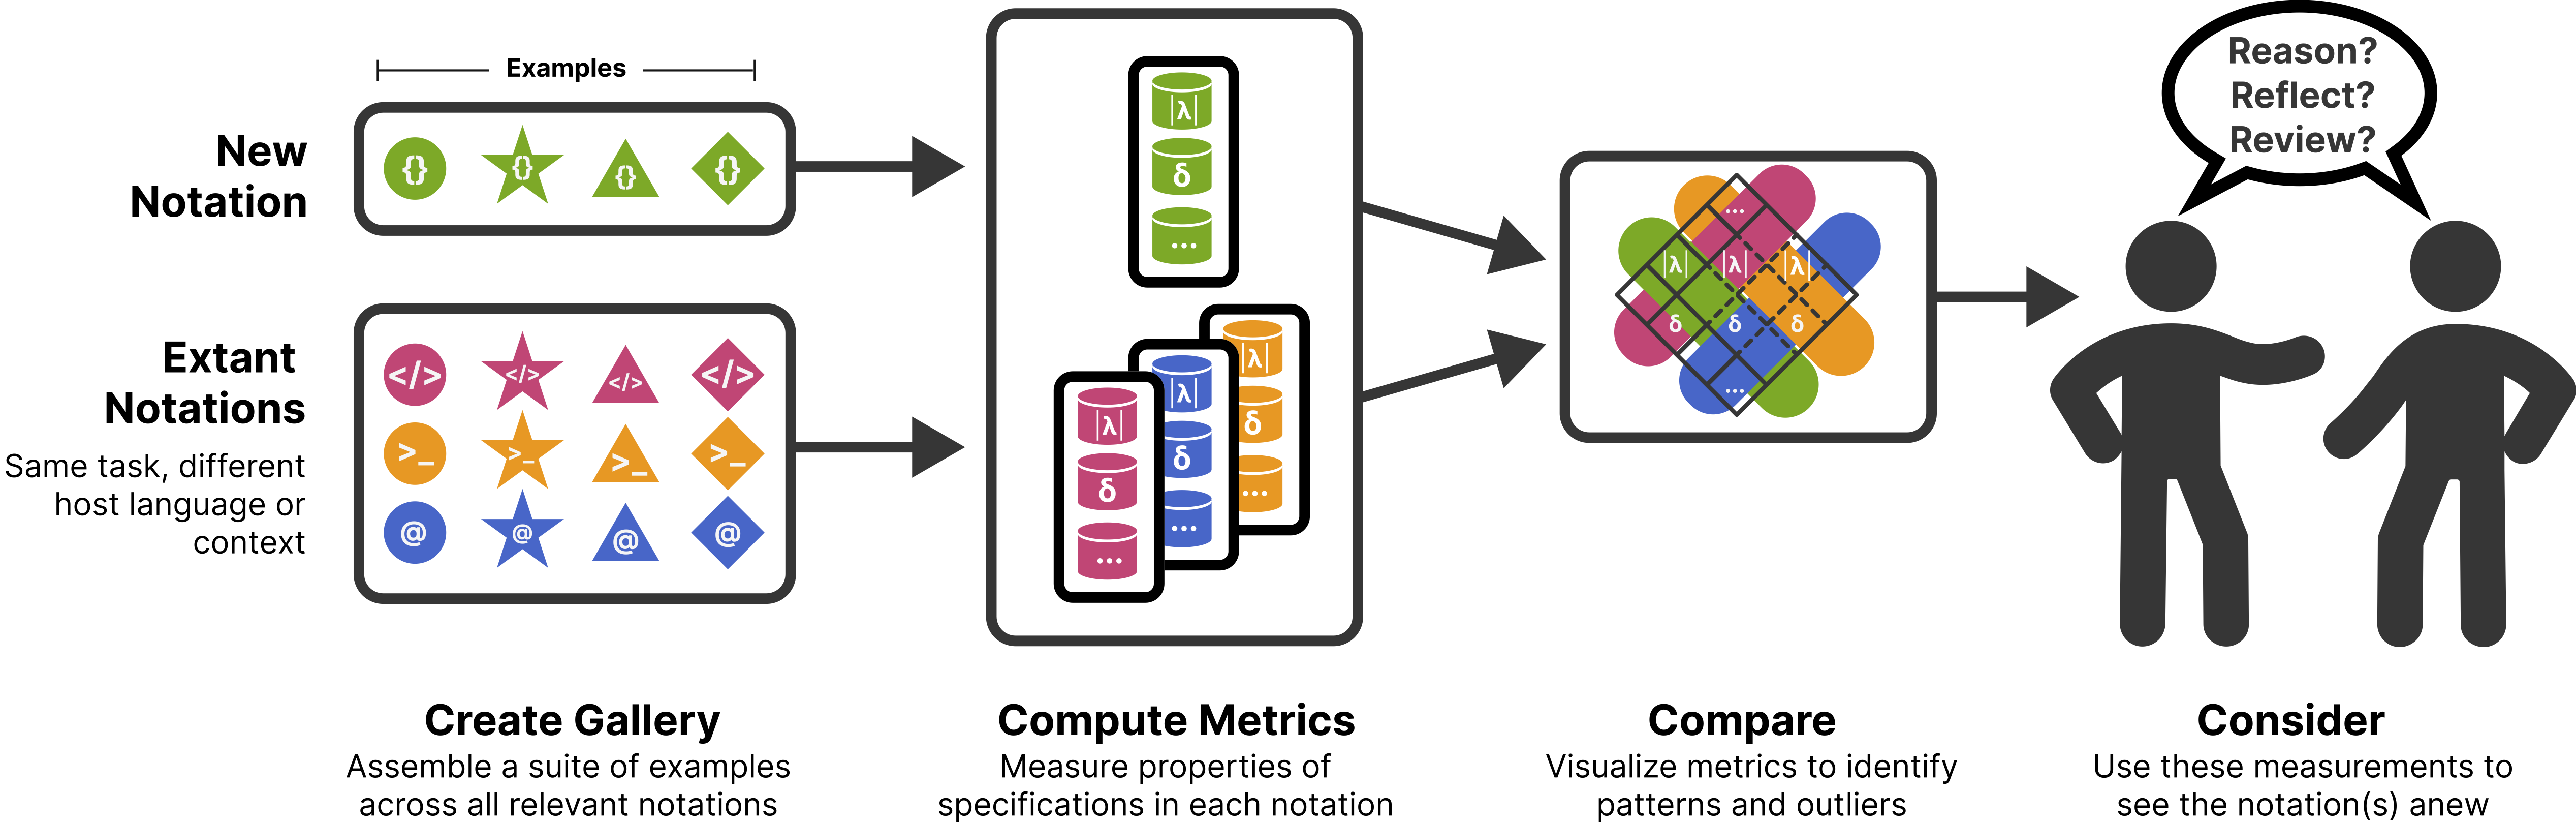
How can we evaluate and compare the usability of ggplot2, Vega-Lite, matplotlib and friends? Here is a summary of the research I’ve been working on and which will be presented at VIS 2023.
How Apple Names Things
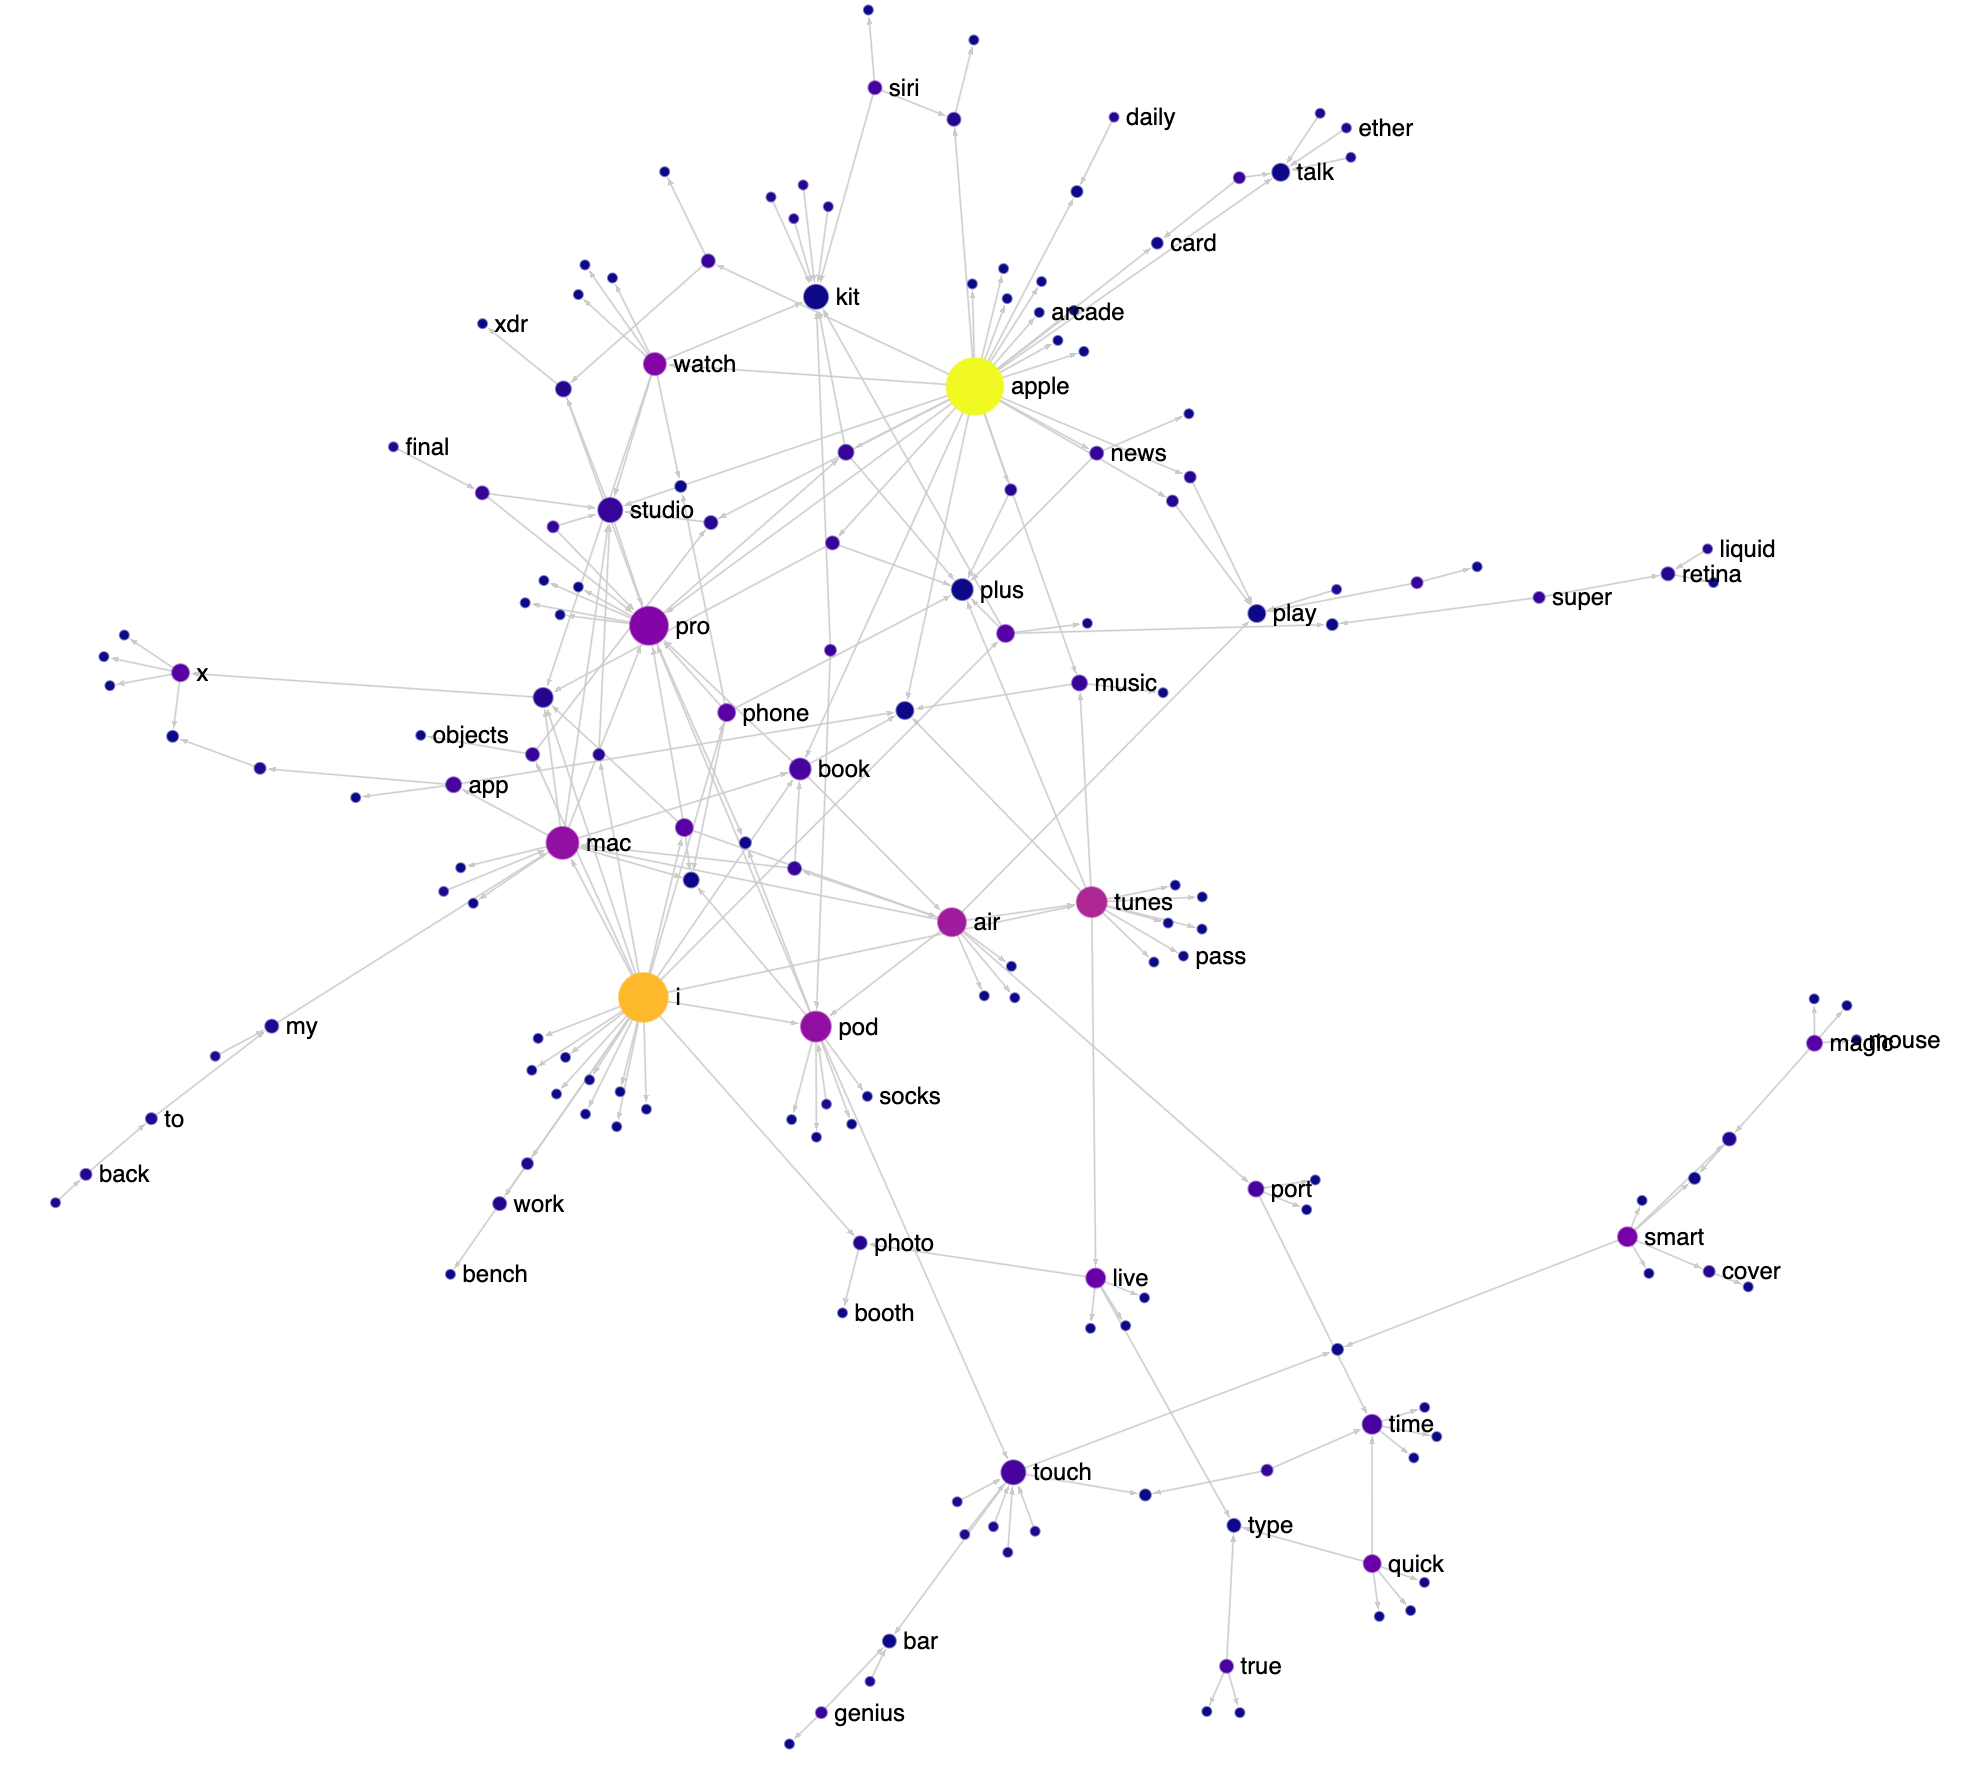
I love the way Apple names things: FireWire, App Nap, iPhone, iPod, EarPod, AirPod, AirPlay, FairPlay etc. It’s playful and there’s a lot of reuse of words and sounds. Having just finished reading the biography of Steve Jobs, I decided to visualize various Apple product and feature names as a network to see this reuse in action. Check out the interactive version here (it works best on a desktop). I got the names from Apple’s public list of trademarks.
IEEE VIS 2022 Highlights

IEEE VIS 2022 was last week in Oklahoma City and I was really happy to have been able to attend in person. The very-earnest motto of the conference was “VIS ’22 is about the people you meet” and for me at least, it really was! I’ll note that my strategy of writing a blog post describing my research and interests and tweeting it ahead of time and posting it to the Discord really helped with meeting people, so I will definitely be doing that again. That said, the personal connections I made aren’t that interesting to read about, so here is my list of highlights from the conference content. If you prefer a longer recap with more photos, Tamara Munzner’s traditional epic yearly VIS twitter thread is also available.
NotaScope: my data visualization research-in-progress
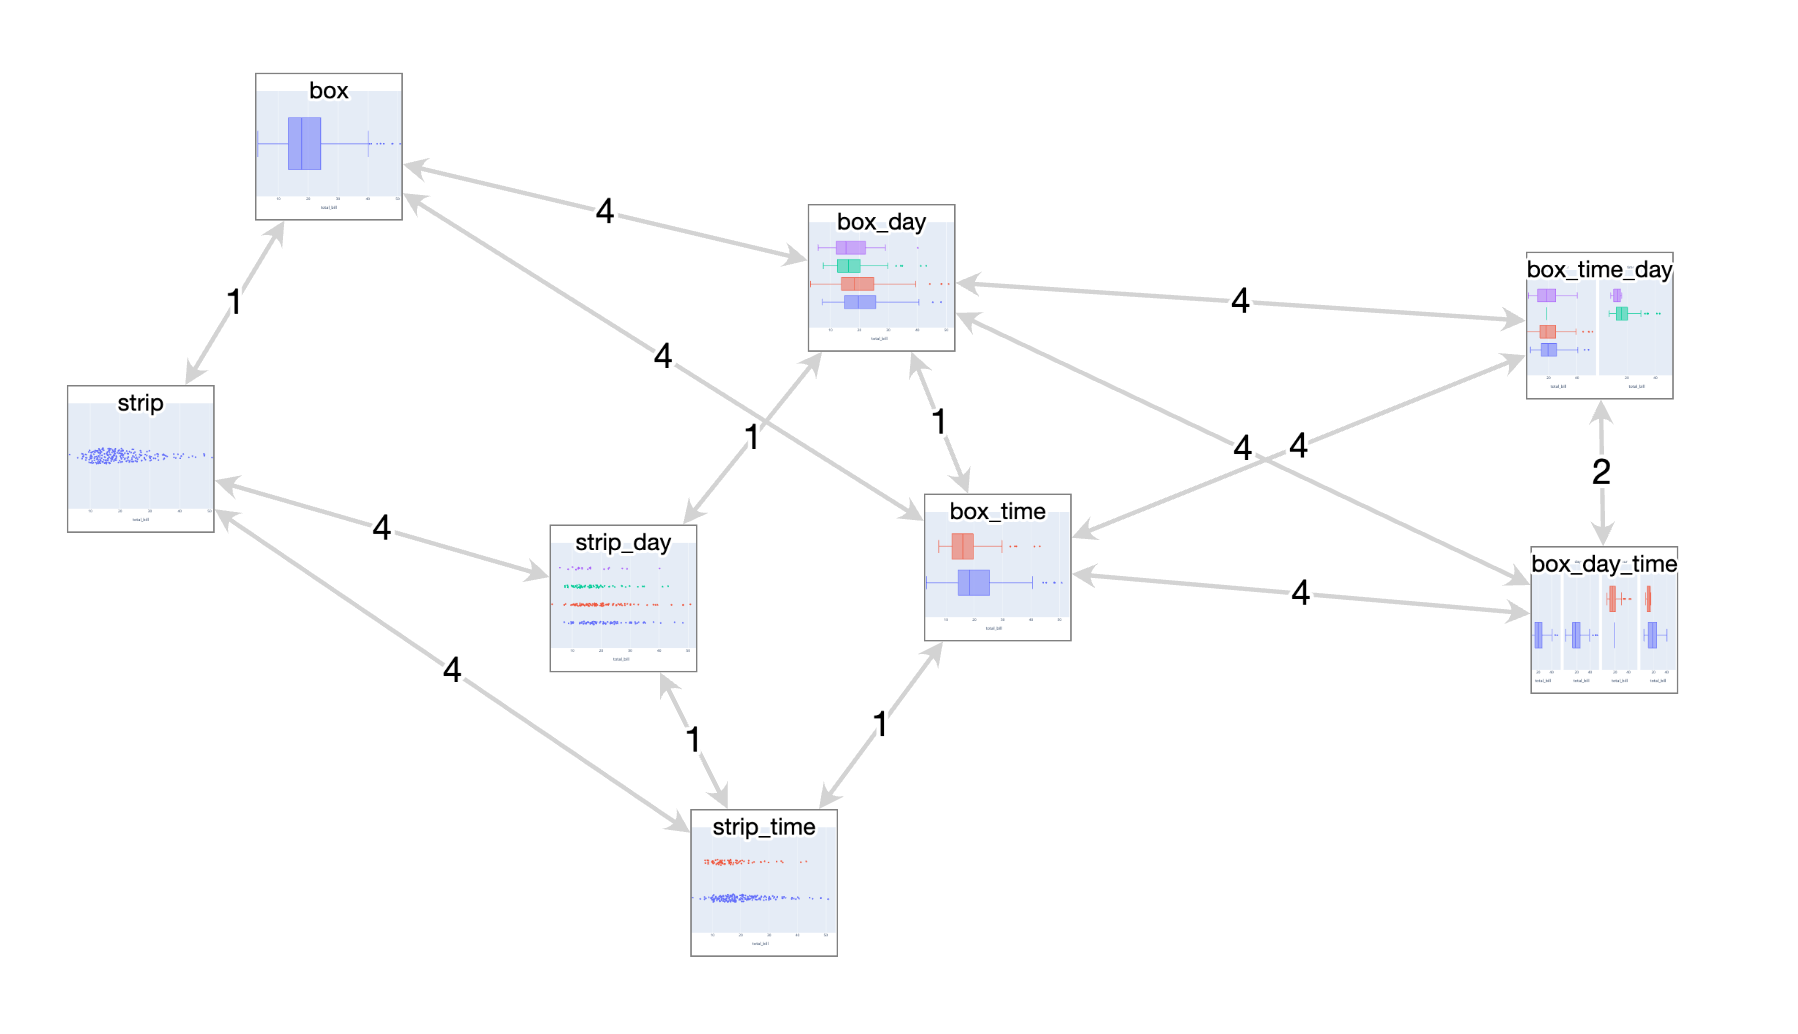
Three years ago I had a great time attending IEEE VIS 2019 as a bit of an outsider, eager to learn about what the cutting edge of data visualization research looked like. I “attended” the next two editions remotely like everyone else, and even participated in a panel at the VisInPractice workshop last year. This year, I’m attending VIS (next week!) in person in Oklahoma City as a bona fide graduate student, as I’ve decided to take a break from working in the tool-making industry and pursue a research-focused masters degree, advised by Michael McGuffin at the École de technologie supérieure here in Montreal. At VIS, I’ll be presenting a paper I co-wrote about VegaFusion, but that’s actually not the primary focus of my research. I’ve decided to write up a little mid-masters progress report, both as a personal check on my progress and to increase the likelihood that I’ll have interesting conversations at VIS next week with folks who have related interests!
Montreal Python: A Fresh Look at the Python Data Visualization Landscape
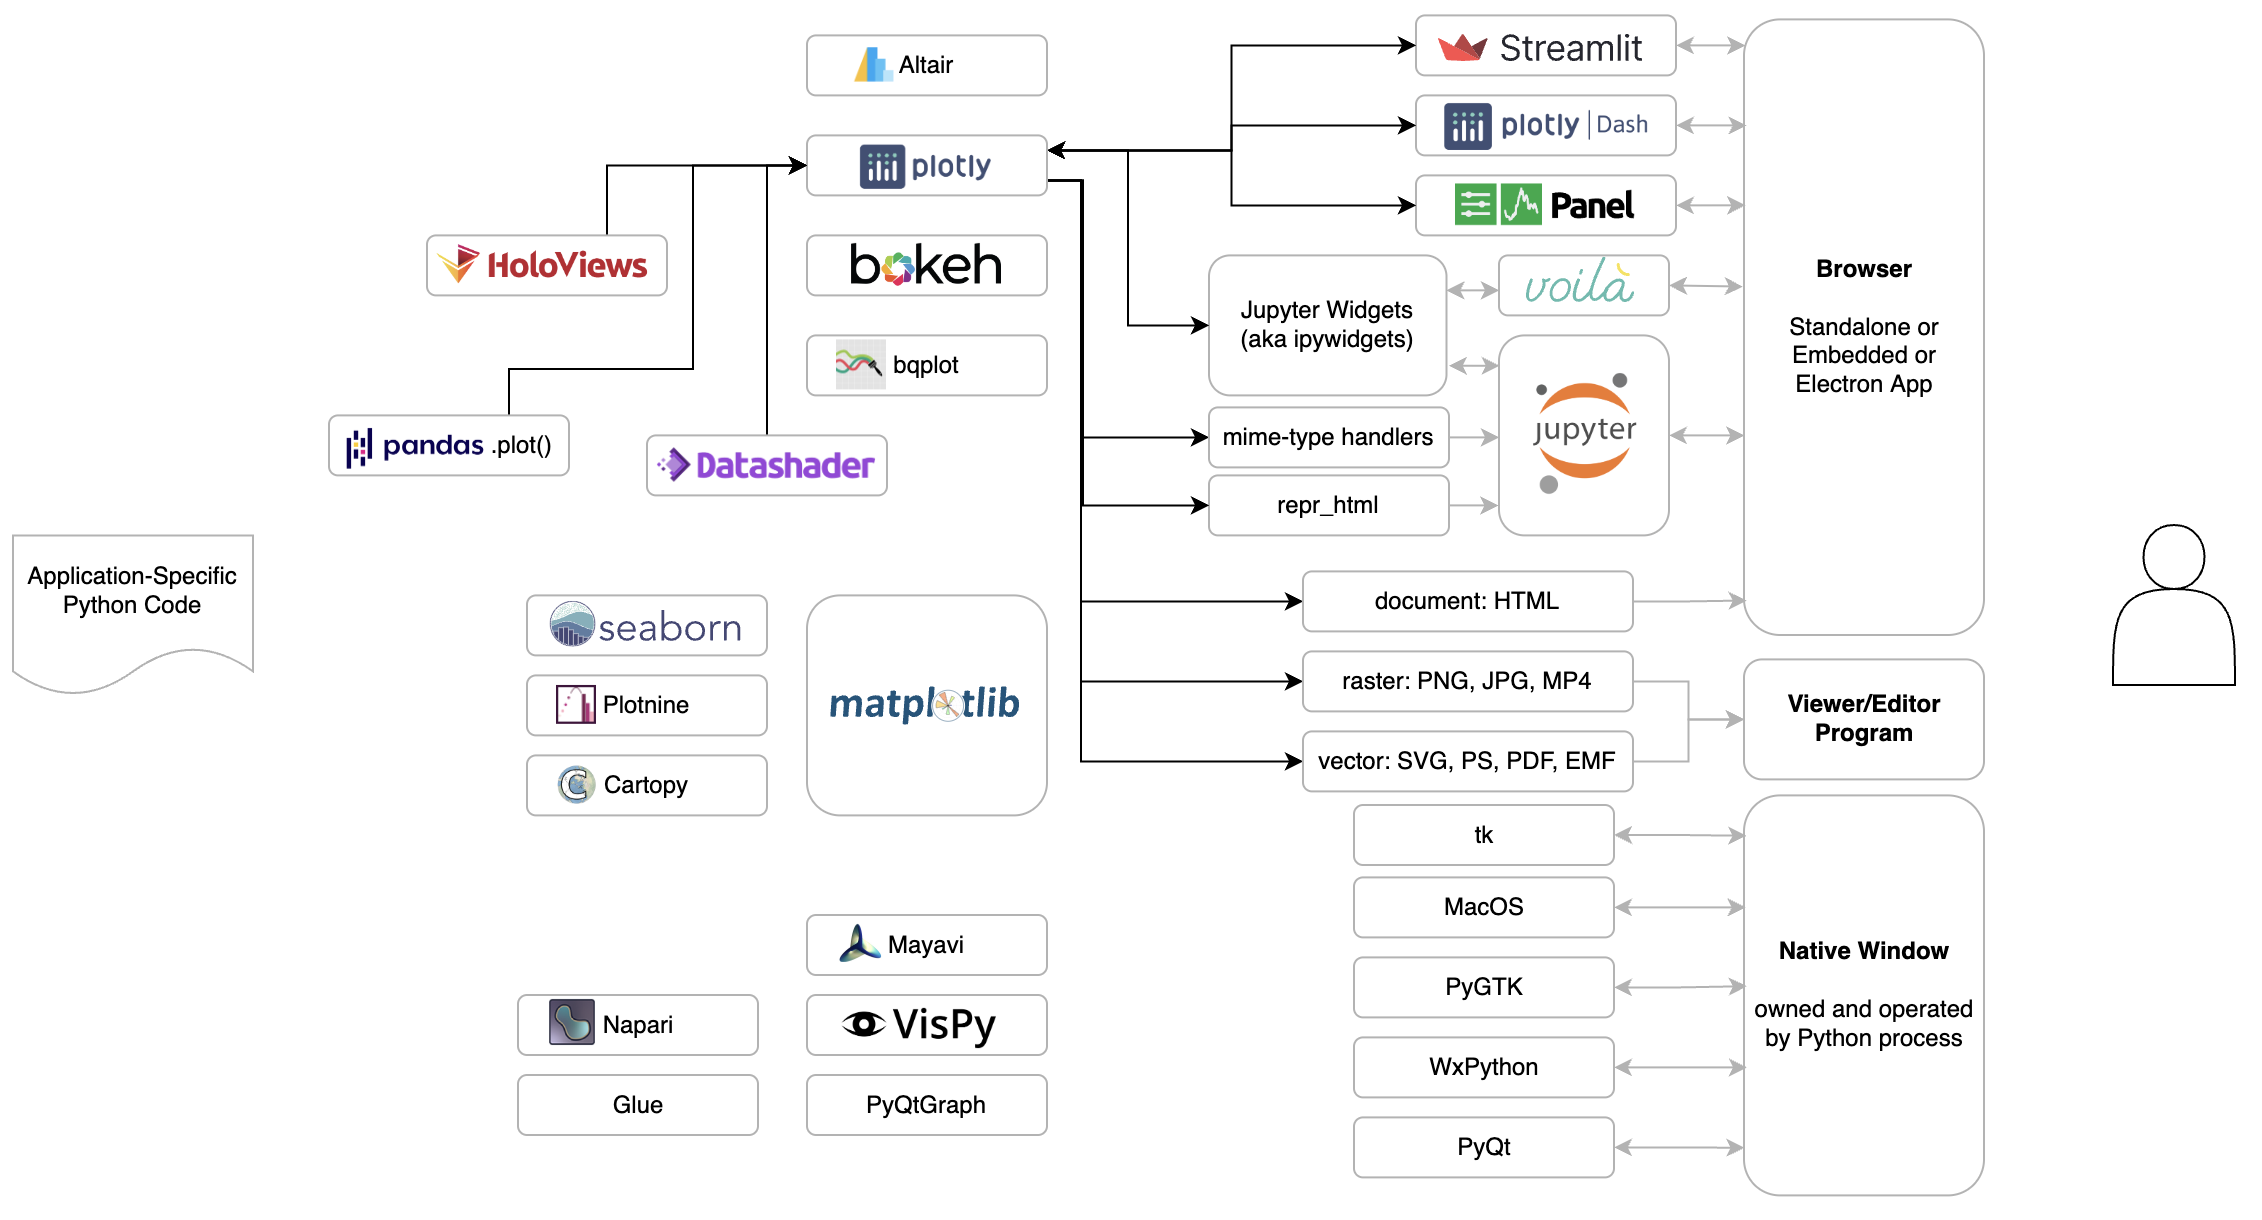
I gave a talk at Montreal Python where I showed a diagram I’ve been working on to capture and explain how the various pieces of the Python data visualization landscape fit together. My presentation is first, starting about 7 minutes into the video.
Deliver Advanced Analytics Faster with Dashboard Engine
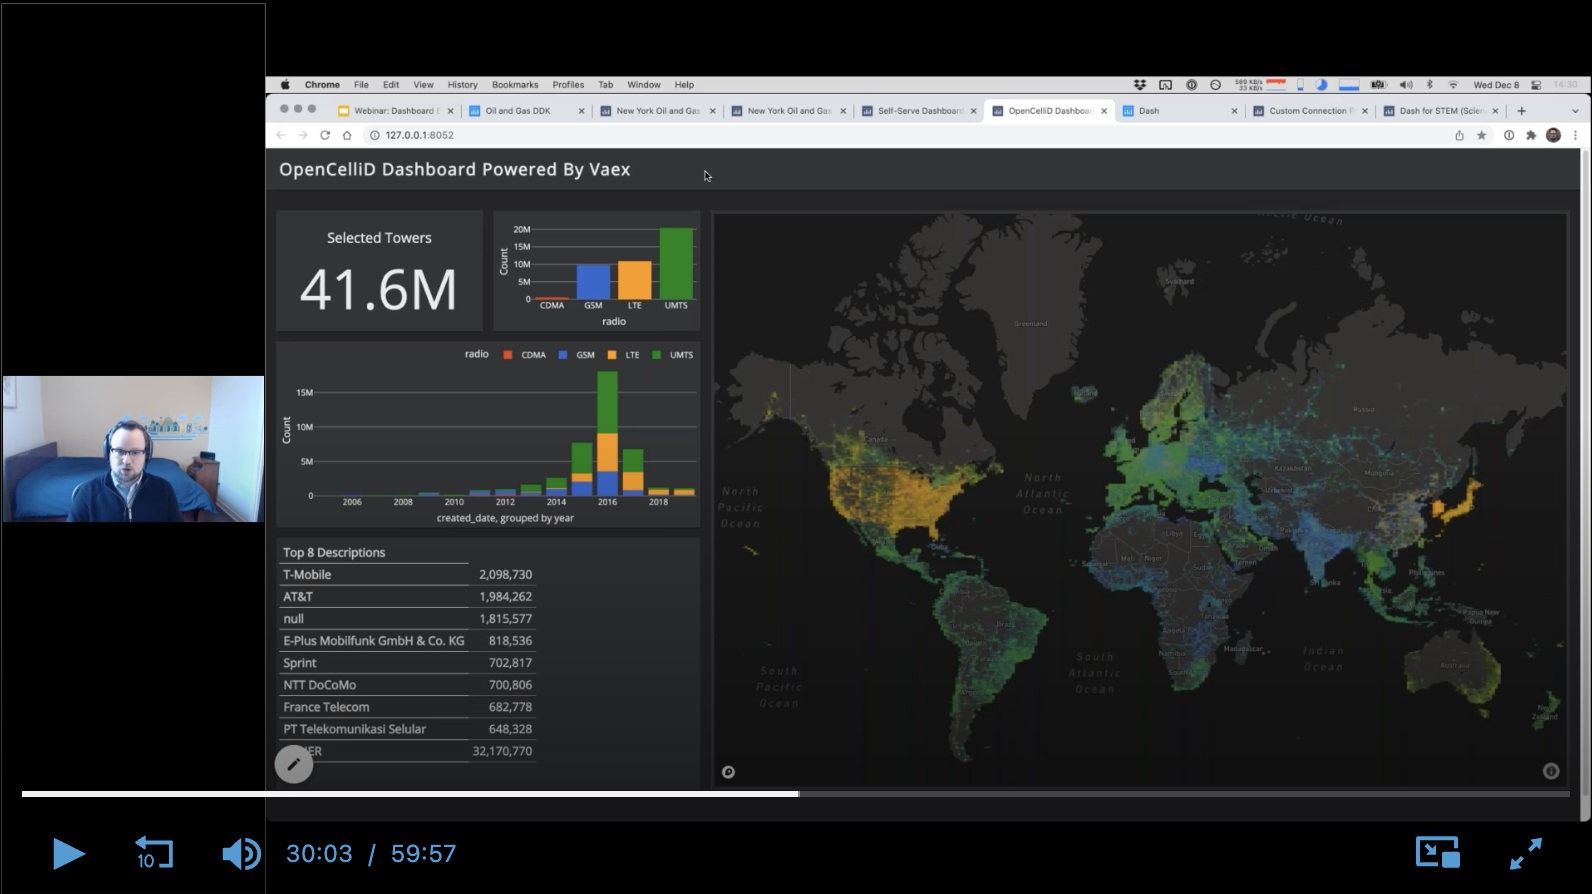
I gave a full-length webinar (name & email required to access, sorry!) about Dashboard Engine, the product my team and I have been working on for 2 years.
Montreal Election Map, 2021 Edition
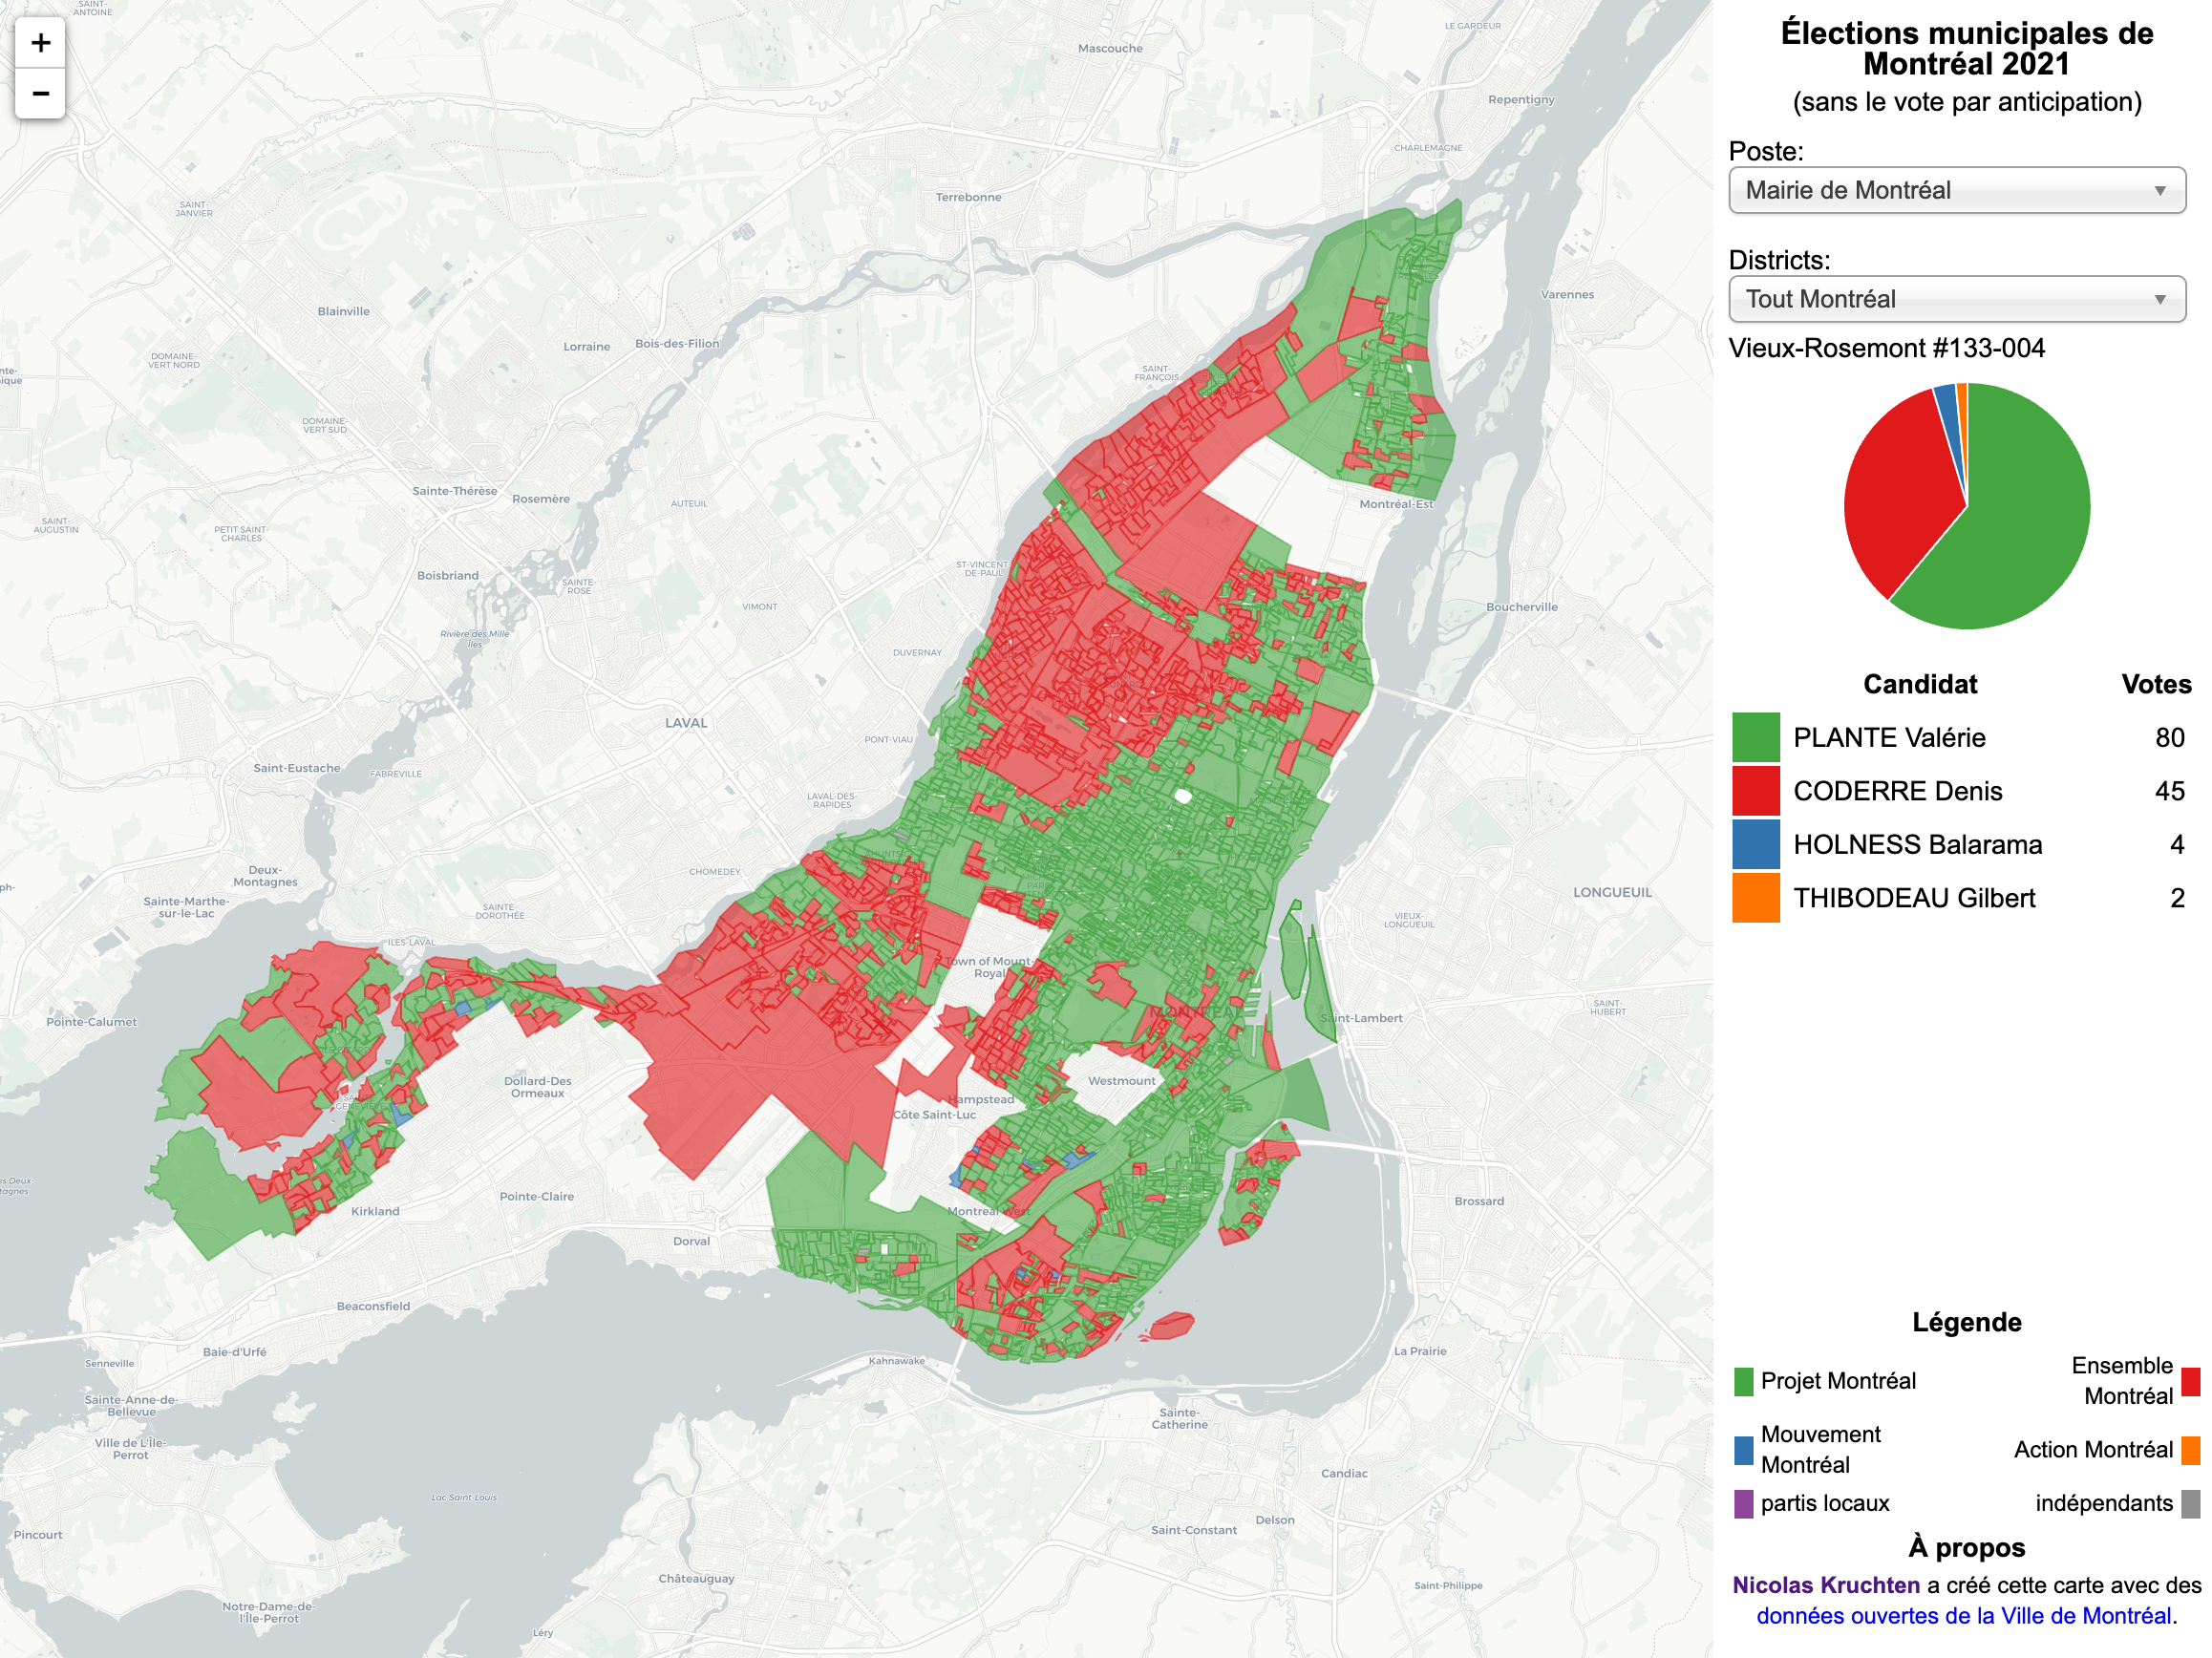
Another four-year cycle, another interactive Montreal municipal election map (see also the 2013 and 2017 editions).
PyData Global 2021: Python Dashboarding Shootout and Showdown
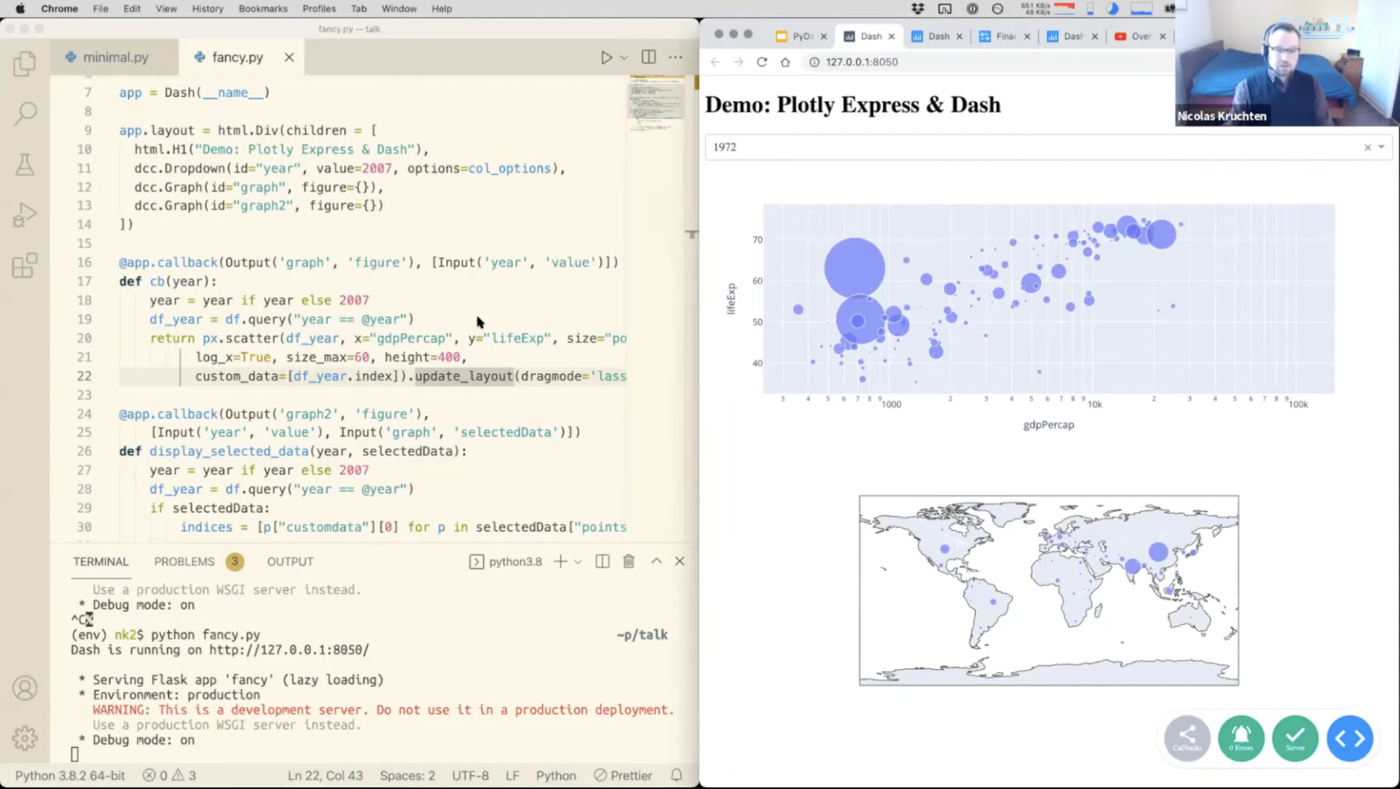
I was on a panel at PyData Global 2021 where folks representing various Python “dashboarding” frameworks compared and contrasted their work with Dash, which I represented.
PyData Global 2021: Why Interactive Data Visualization Matters for Data Science in Python
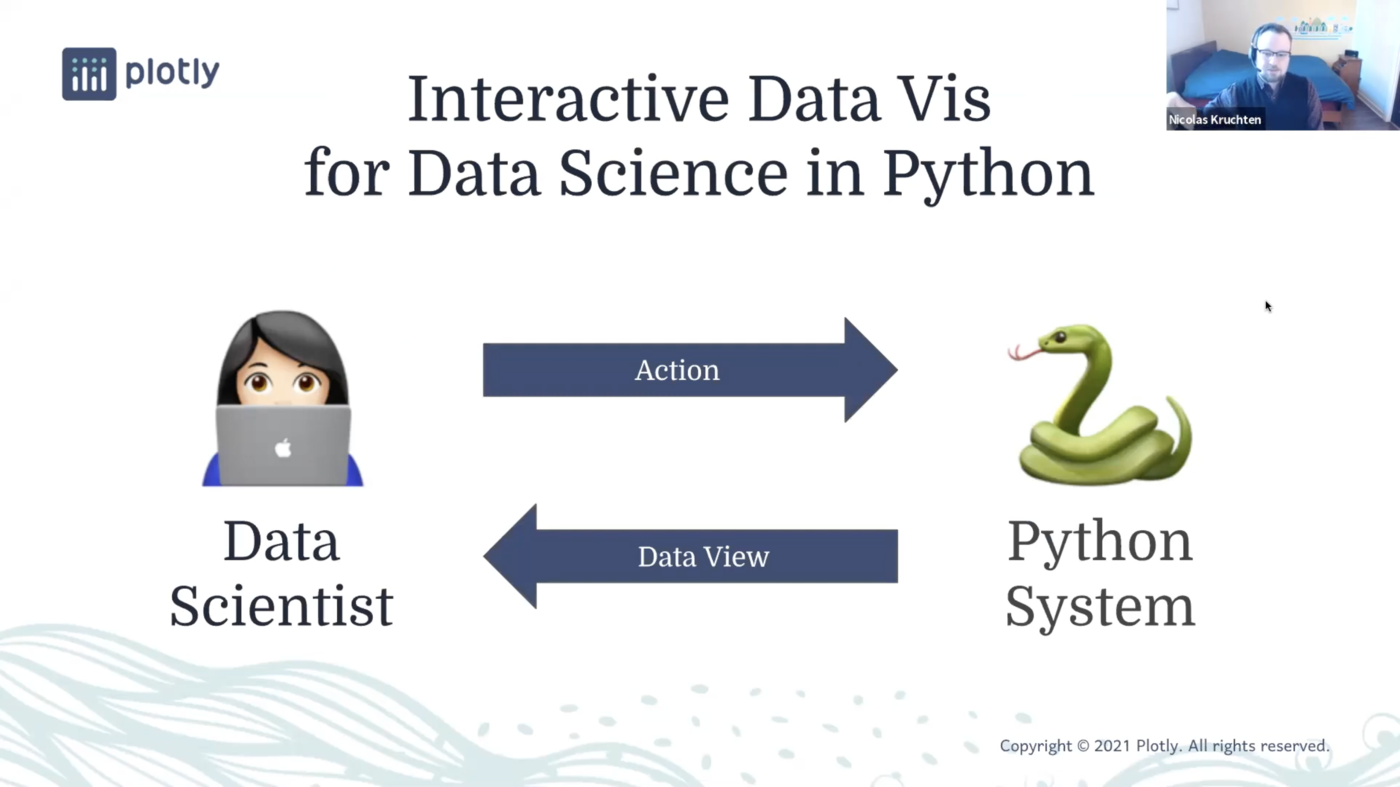
I gave a talk at PyData Global 2021 that pulls together some ideas about why interactive data visualization matters into what I hope is an interesting and useful framework.