Context
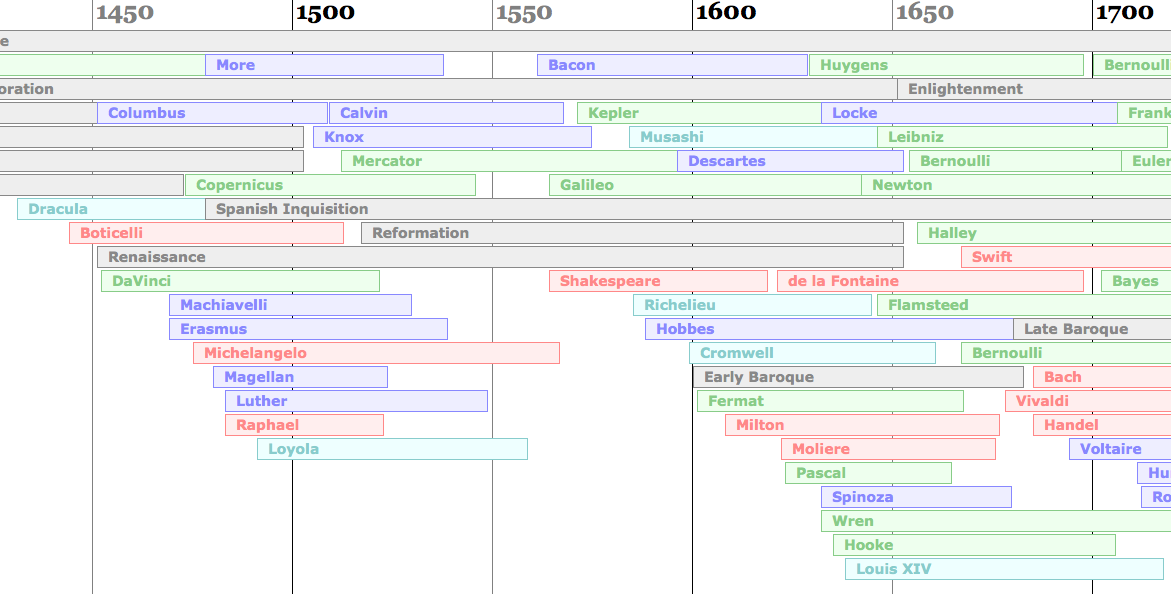
I always have trouble remembering what famous people were alive when, and more importantly, who was alive during, before or after who’s life. It’s easy enough to remember which philosopher came before which other philosopher or which scientist came after which scientist, but often harder to remember which scientist came before which philosopher etc. So I built a PHP script to automatically lay out an HTML timeline to help keep all this stuff in context. I then decided to learn how to use XSL and rebuilt my little experiment using that. Click here with a modern browser to open the timeline.
The way it works is that there’s an XML file (hit ‘view source’ on the timeline) which stores the information regarding name, start and end dates as well as ‘type’ of timespan. Your browser transforms this XML file using an XSL stylesheet (context.xsl) into an XHTML document which it then displays. A CSS stylesheet (context.css) tells your browser what colour to make things. The XSL sheet inserts links to Wikipedia regarding the various timespans. On IE, you can click around and a vertical marker appears.
This could be made much more powerful with some server-side manipulation or parameterization of certain constants, but my goal in playing with this stylesheet was to see how far I could get using only static XML/XSL.
The stylesheet is a little difficult to understand because it’s all recursive and has to do some gymnastics to figure out what vertical position is free to start the next timespan. This was an interesting exercise in converting an imperative PHP script into a declarative XSL stylesheet.
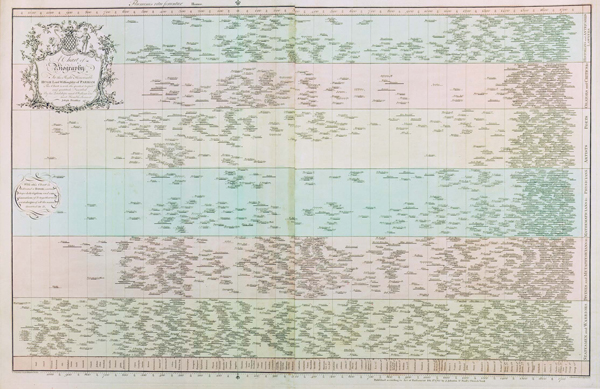
Edit 2013-01-10: it turns out that according to Tableau Software, the #1 most influential visualization ever was Joseph Priestley’s Chart of Biography, a very similar visualization from 18th-century, obviously done by hand.
⁂
Follow Nicolas
Code on Github
Code from this post is up on Github at nicolaskruchten/context