Nicolas Kruchten
is a data visualization specialist
based in Montreal, Canada.
Real Time Bidding, Characterized
There doesn't appear to be a good Wikipedia entry for RTB for me to link at the moment, when I want to blog about it so I'll draft my own explanation here. (Edit: there is an entry now, but I like my characterization better!) Keep in mind while reading this that I'm looking at RTB as a software engineer with an interest in economics, rather than as an ad industry veteran!
Using make to Orchestrate Machine Learning Tasks
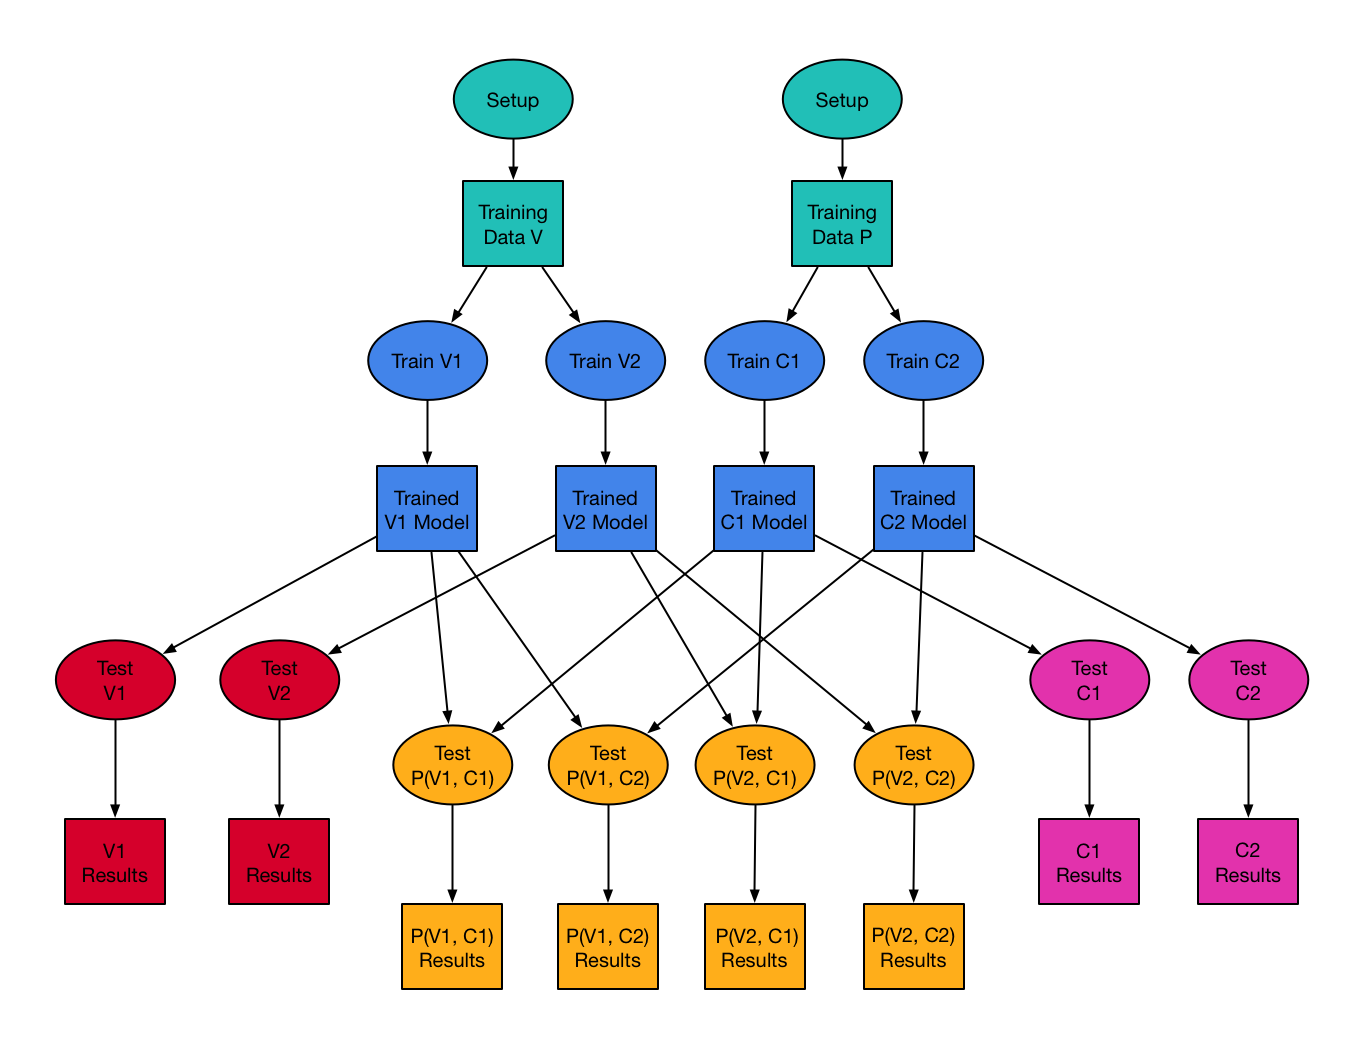
One of the things we do at Datacratic is to use machine learning algorithms to optimize real-time bidding (RTB) policies for online display advertising. This means we train software models to predict, for example, the cost and the value of showing a given ad impression, and we then incorporate these prediction models into systems which make informed bidding decisions on behalf of our clients to show their ads to their potential customers.
Datacratic's Dataviz System
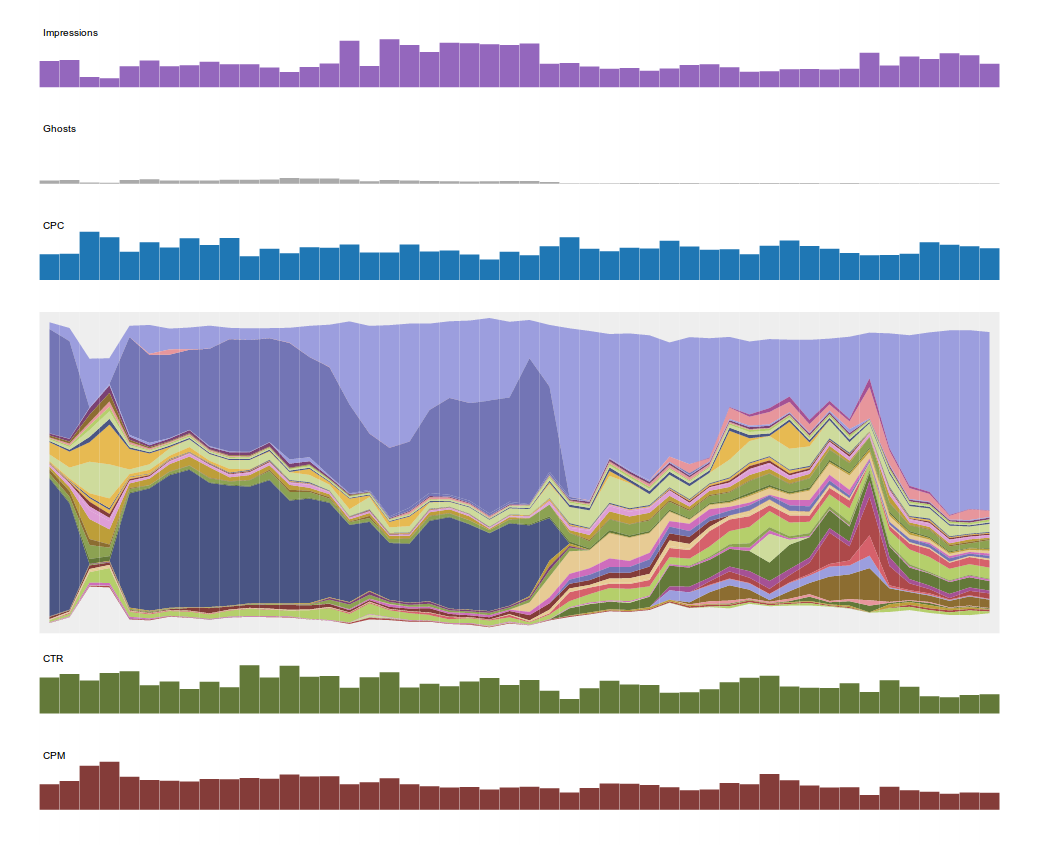
At Datacratic, working with data often means data visualization (or dataviz): making pretty pictures with data. This is usually more like making fully machine-generated images than carefully laying out "infographics" of the Information Is Beautiful school but I find they usually end up looking pretty good. There are lots of good tools for graphing data, like matplotlib or R or just plain old Excel-clone spreadsheets but what we use most often is Protovis, the Javascript library for generating SVG, coupled with CoffeeScript, which is a concise and expressive language that compiles down to Javascript.
Rancilio Silvia iPhone Remote Control
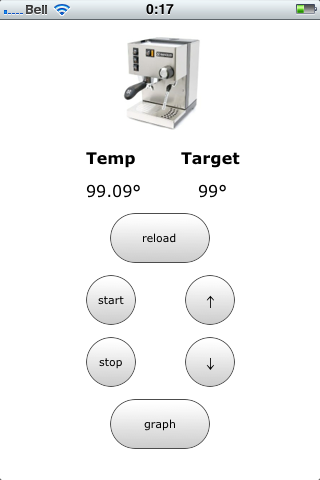
This is a screenshot of what I pull up on my iPhone every morning now after its alarm clock wakes me up. That's right, it's an interface to turn on my espresso machine so that it will warm up to a specific temperature by the time I'm done snoozing! I can even look at a real-time plot of the temperature to confirm that it's holding where it should be and doesn't need to bumped up or down a degree.
Statsd, Graphite and Nagios
At Datacratic we tend to worship, like Etsy (and AppNexus!), at the Church of Graphs. We've even started using Statsd, the system they've released to collect stats and relay them to Carbon for display in Graphite. And by display, I mean display on a dashboard visible to the entire dev team at the office, as seen above! Statsd is a very simple system to which you can send UDP messages about various stats you want to track, which it then aggregates and passes along to Carbon, which stores them in Whisper, Graphite's back-end data store. That's a lot of moving parts but it works very well. Sending stats to statsd is extremely easy from any language (we do it from Javascript and C++) and carries low overhead, which is key for the type of work we do.
Graphing Silvia Temperature on iPad
So I finally got around to working on my Silvia Mod Plan, getting all the way to Step 5! The video above is a demo of the setup I have to show a real-time graph on my iPad of the boiler temperature in the Silvia.
Having installed the thermocouple in the Silvia and played with my TC4 shield, my initial plan was to use the Arduino to transmit data to my iMac using XBee as a wireless serial link, where I would run a NodeJS process which would read data from the USB port and which would communicate with the iPad via a WebSocket over Wifi (phew, mouthful!). Ideally the Arduino would speak Wifi but in the meantime I figured I'd play with this setup. I chose NodeJS because it seemed really easy to set up WebSockets using socket.io, and that seemed like a good way to feed data to Smoothie Charts for real-time graphing. I rewrote the code in CoffeeScript, because it's the best way to write NodeJS code IMO (a discovery I made after writing the first version of this code 4 months ago) and because it's so fitting for this project!
Silvia Mod Plan
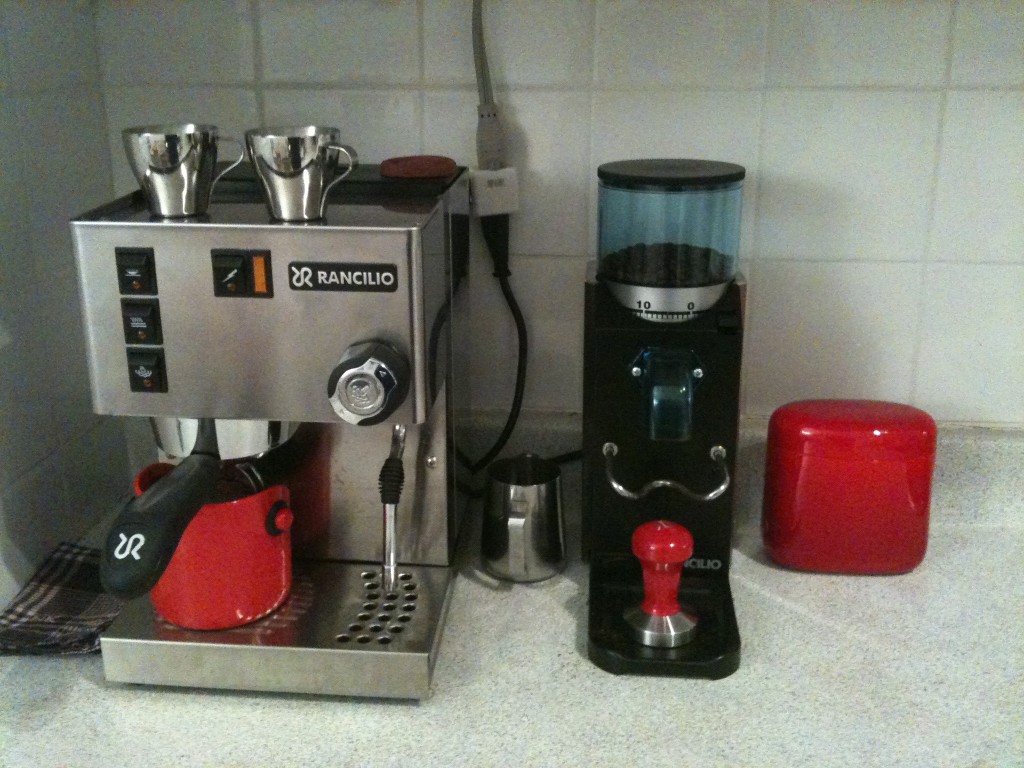
So in October I finally bought the Rancilio Silvia I'd been coveting (after coveting a La Pavoni manual espresso machine first!) with the intention of modding it to add digital temperature control to it, as many have done. This basically involves replacing the stock thermostat with a thermocouple and solid-state relay, plugged into a digital control unit which does PID control. Now being a software guy who likes to tinker with his Arduino, I pretty quickly decided that I wouldn't use a standard industrial controller but I would build a custom one (kind of like this one, but read on for differences). In addition, I decided I didn't want to hang anything from the Silvia or make any externally-visible modifications, partly for esthetic reasons, but mostly because I'm not too good at making good-looking hardware myself. So I decided I would build something I could control wirelessly, from my iPhone for example. "Control" in this case basically means occasionally changing the set point of the controller, and maybe turning it on remotely. One other feature which would be nice would be a timed on/off feature, like "on 30min before I wake up" and "off after 1h of disuse" or something like that.
hackMTL Inbox Social Network Visualization
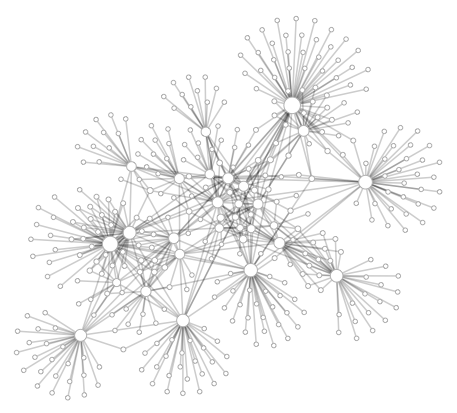
On Saturday I attended hackMTL, a one-day hackfest/competition. The ground rules called for creating an app using at least one of a list of API's. The one that caught my eye was the DokDok API (now Context.io), which basically gives you programatic read access to your GMail inbox via HTTP/JSON. Since June or so I've been doing more and more visualization of data that I work with (first at Bell then at Recoset) so I figured I'd see if I could make an app that could make a neat picture of my social network, as it's represented in my inbox. I didn't quite finish an "app" per se during hackMTL but I did manage to make a pretty picture (above). The code is up on GitHub, and basically it's a Python script that creates a JSON file which is rendered using Protovis. The circles/graph nodes represent email addresses (aka people) and the links between nodes indicate that the two parties were on the same GMail thread.
Wanderer v2, with Wireless Wii Nunchuck
After building my little autonomous wanderer robot, I saw this iPad-controlled blimp and went ahead and added iPad control to my robot too. I had a Python script on my iMac which took commands from the iPad over Wifi and relayed them to the Arduino using XBee. I demo'ed this at BitNorth 2010, but I'm not sure if the video is up yet. That said, the fact that all the commands were relayed through a 'base station' bothered me, and I saw a cheap wireless Wii Nunchuk which I immediately bought, thinking I could make it into a really ergonomic remote control for my little robot. I probably could have gotten a Wifi shield instead, but I was up for a different kind of challenge.
Arduino Wanderer v1
Back in April I got an Arduino Duemilanove and a variety of sensors and actuators, which promptly caused me to go order a rover base from RobotShop.ca, and a few days later, I had put this little guy together! Truly, Arduino is an easy-to-use platform for this sort of thing. I went on to put together an iPad-controlled version as well as a wireless Wii-Chuck-controlled version but I'll post about those later.
