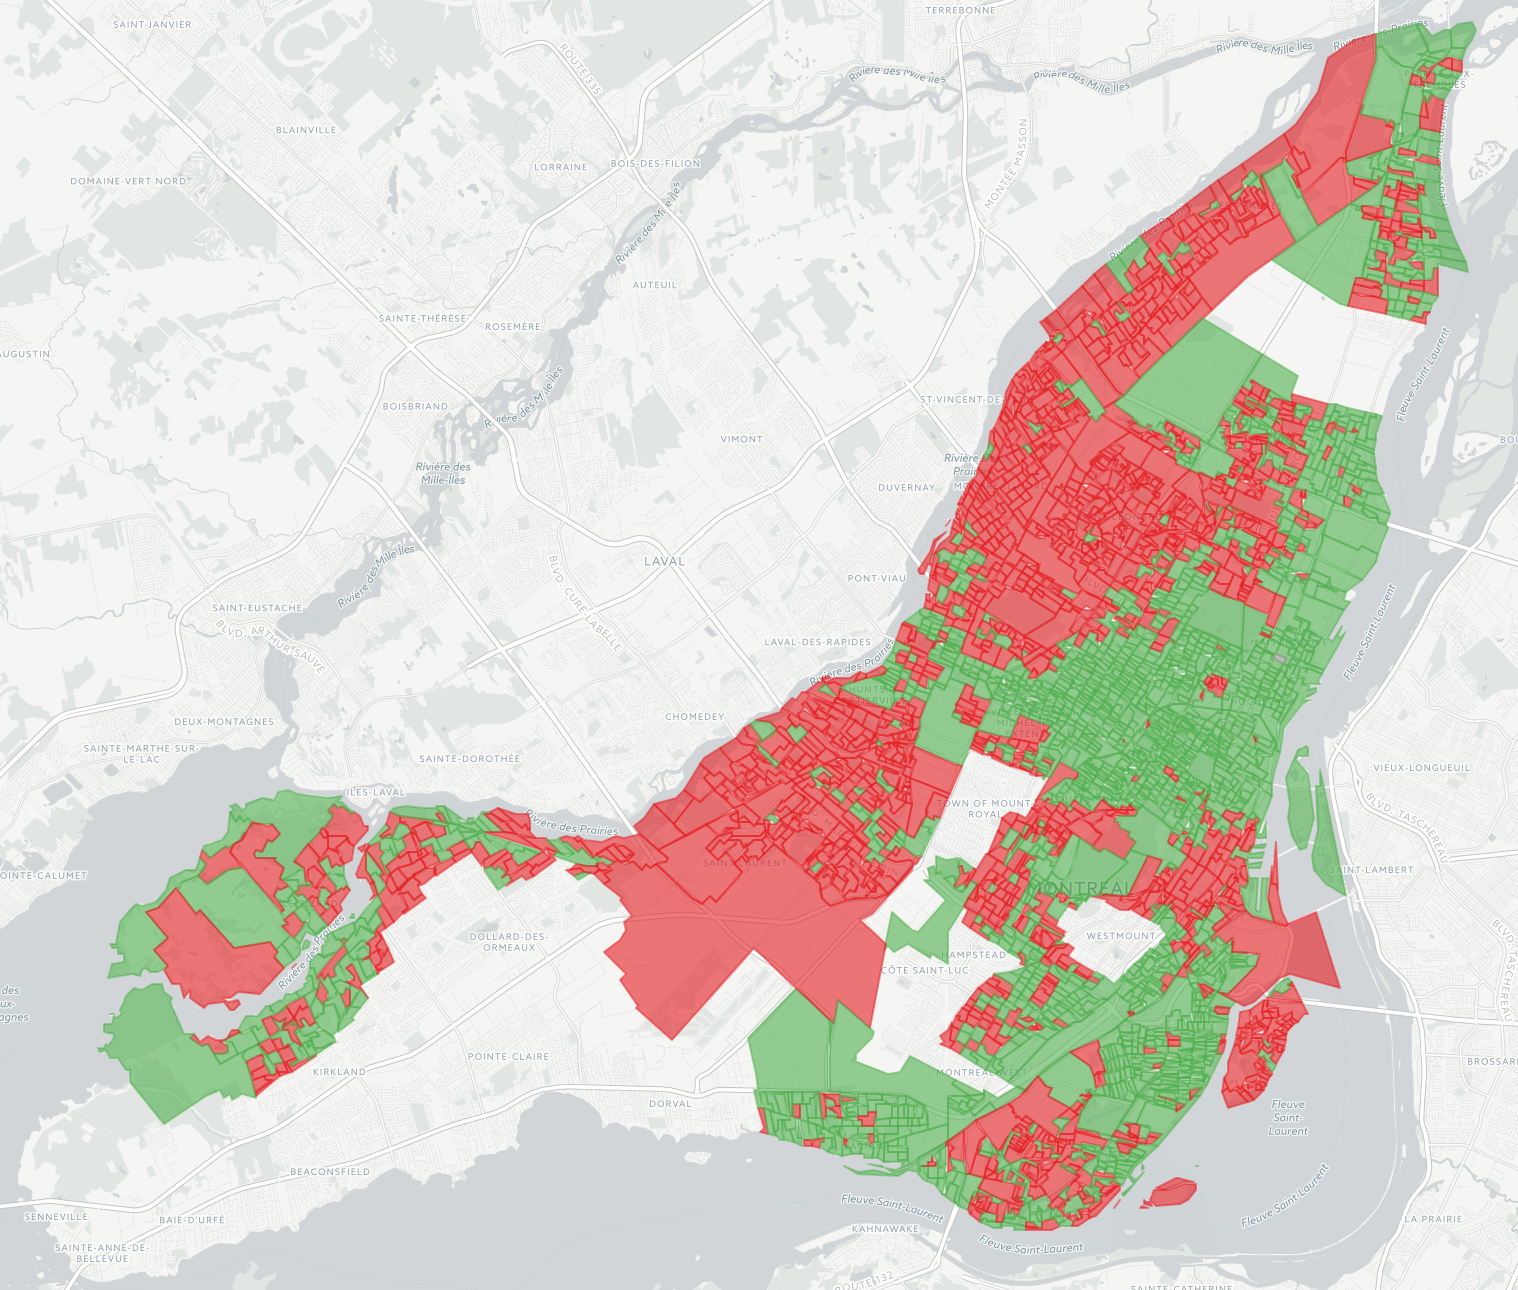
Map of All 2017 Montreal Election Results

The 2017 edition of my interactive map of Montreal election results is now available, and I’m so pleased about the results it shows! In 2013 I made a map a couple of months after the election and it was considered so unusual it was talked about on the radio. But times have changed: this time the data was available within days, and within hours of that, news outlets had similar maps on their websites. I still like mine better though because it shows data from all 103 races, rather than just the mayoralty. The 2013 map is still around, for reference.
⁂
Follow Nicolas
Code on Github
Code from this post is up on Github at nicolaskruchten/mtlelection2017bysection
More Montreal
© Nicolas Kruchten 2010-2025