VisMtl #5 Roundup

I recently organized and MC’ed the fifth Visualization Montreal meetup, and I think it was a great success! The concept was to have a series of 7-minutes-max flash presentations from Montrealers where each one would show off a single visualization project. The rules were: no slides, no tools, just one publicly available data visualization. We had 12 presenters including me, with a good mix of types of data and visualizations. Below is the list of visualizations that were presented, and you can find photos of the event here.
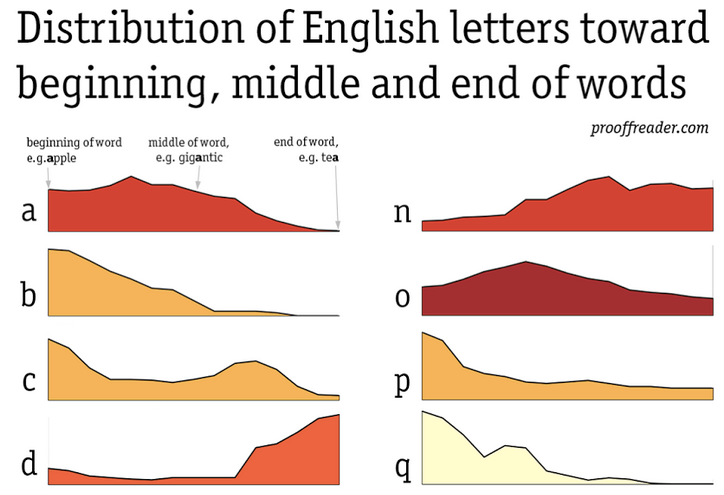
Distribution of English letters within words
David Taylor, Prooffreader
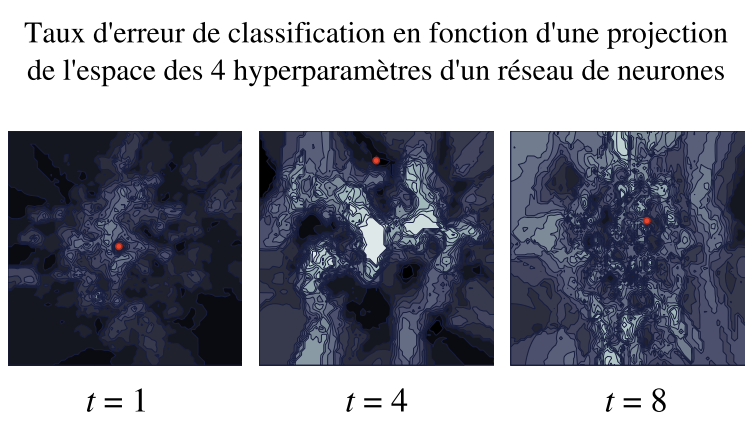
Taux d’erreur de classification
Jean-François Connolly, Datacratic
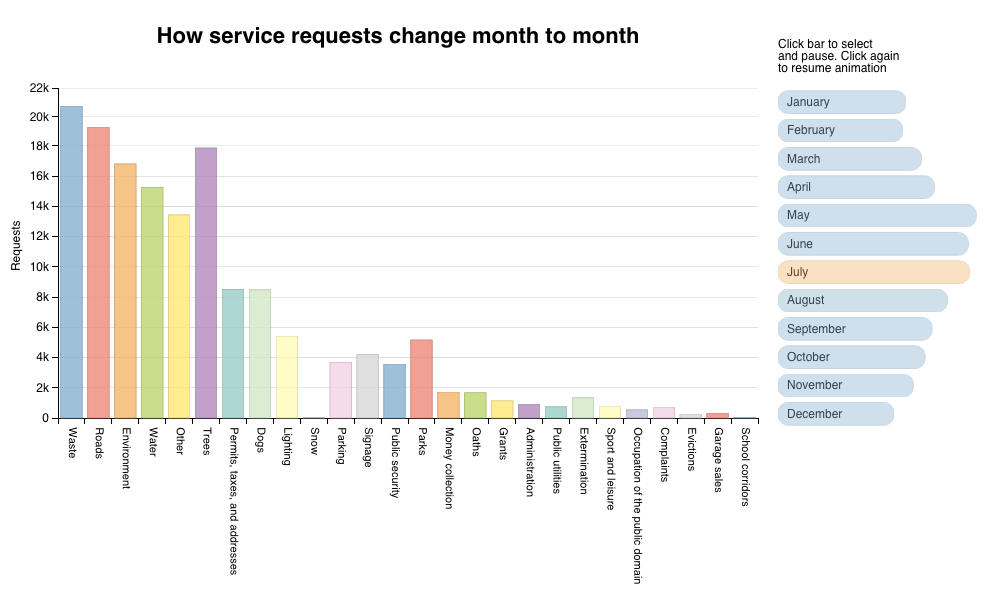
Ville de Montréal Service Requests
Roberto Rocha, Montréal Gazette
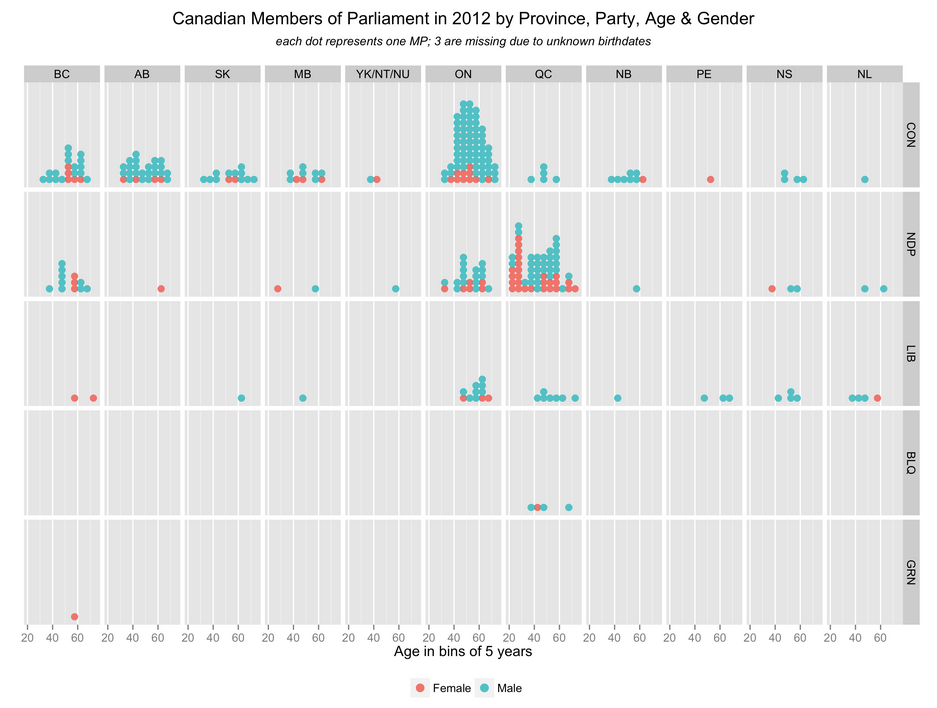
Canadian MPs 2012
Nicolas Kruchten, Datacratic
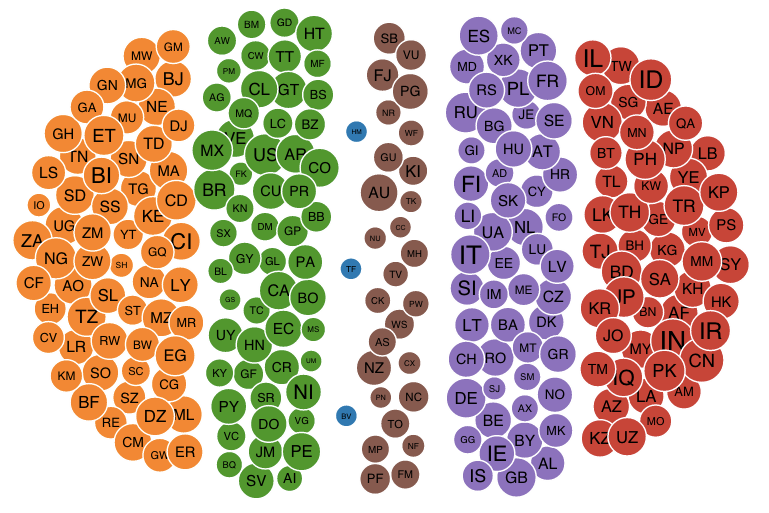
The Bubble World Countries List
Kéosavang Aphisith
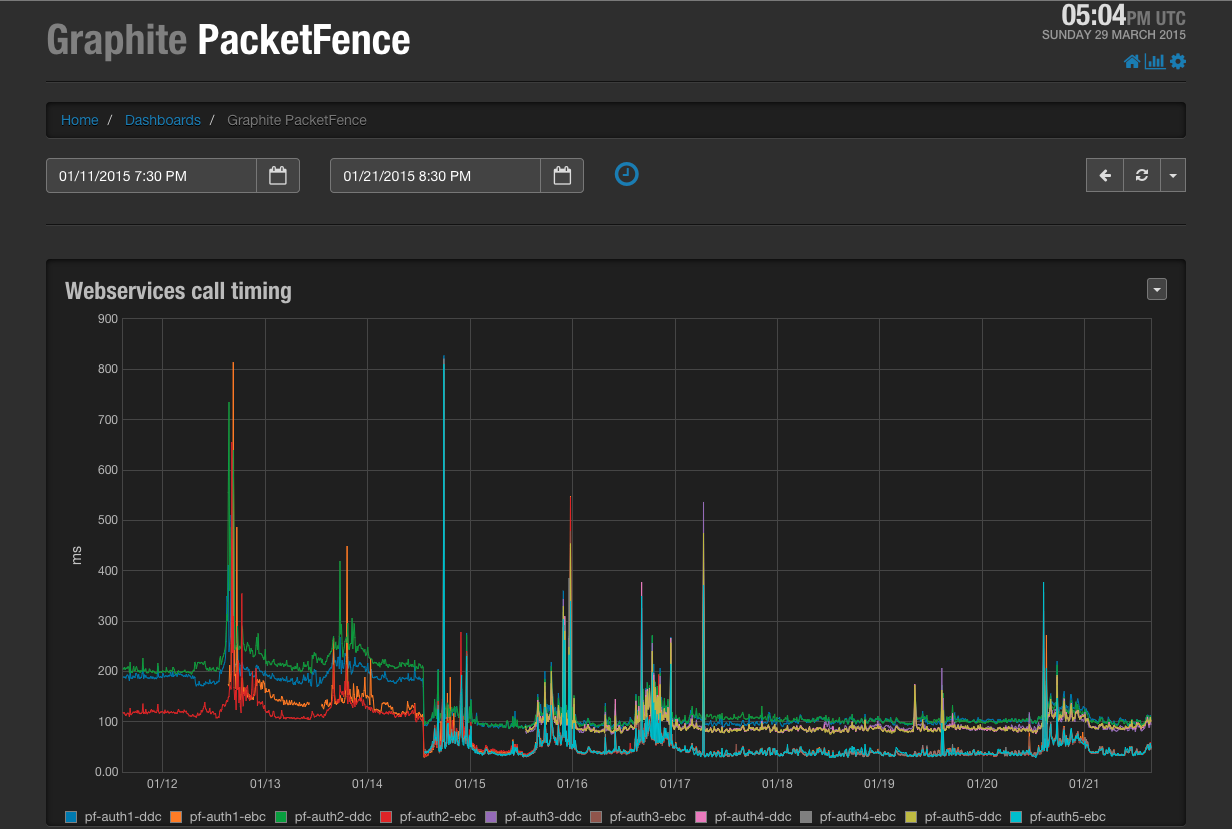
Survivre à la rentrée universitaire avec Graphite et PacketFence
Louis Munro, PacketFence
(link to original unavailable)
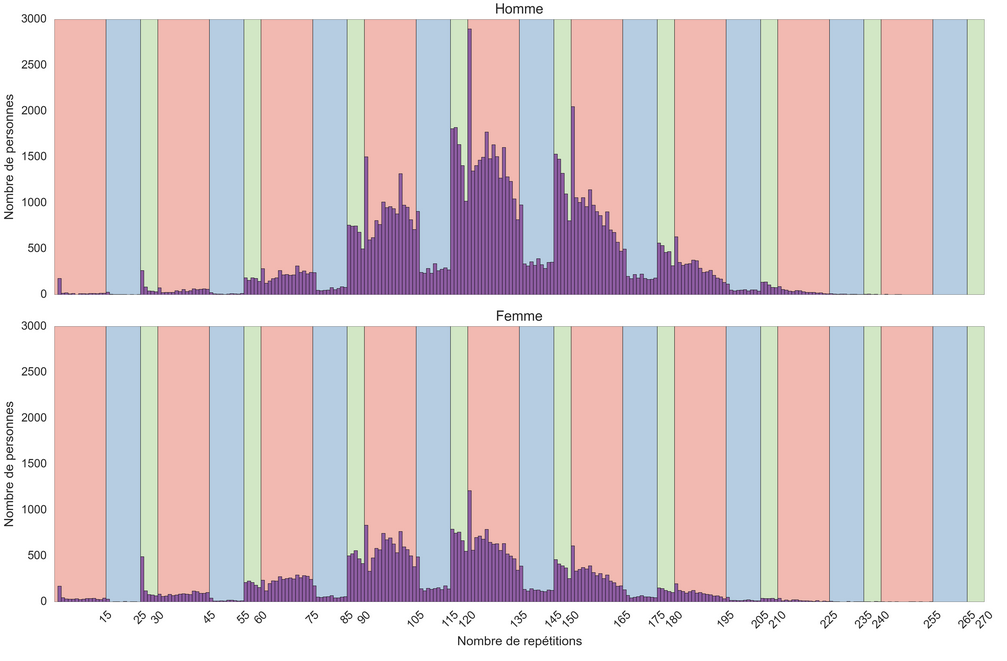
Crossfit Opens Workout
Alexis Tremblay, Datacratic
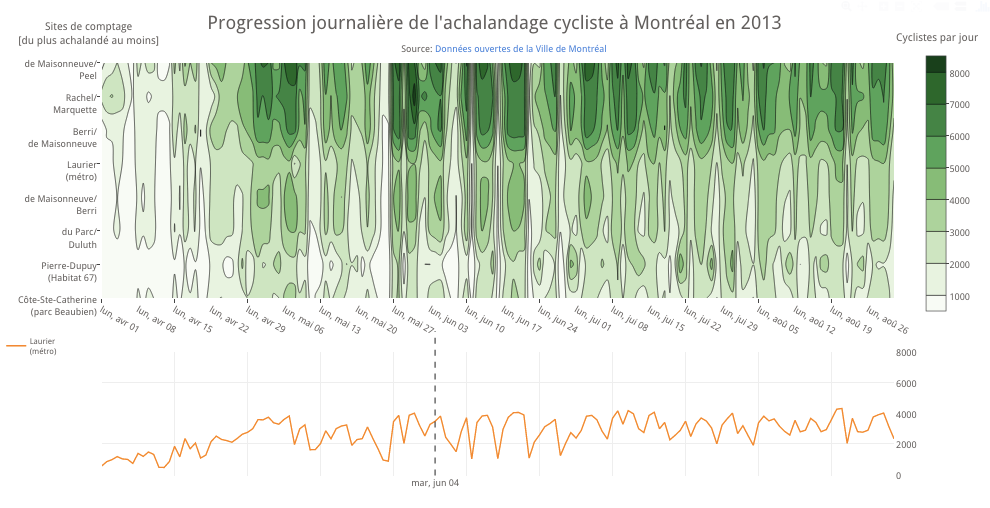
Montreal Bike Traffic
Étienne Tétreault-Pinard, Plotly
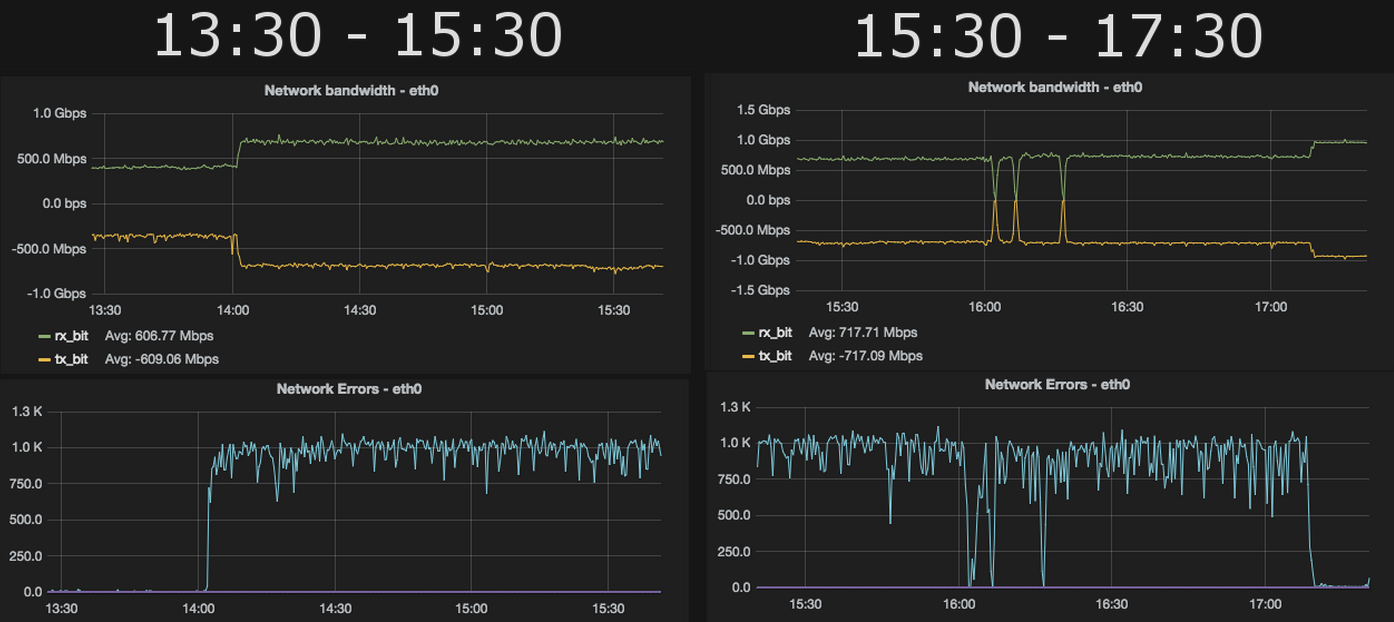
Les tuyaux sont pleins
Jean Raby, Datacratic
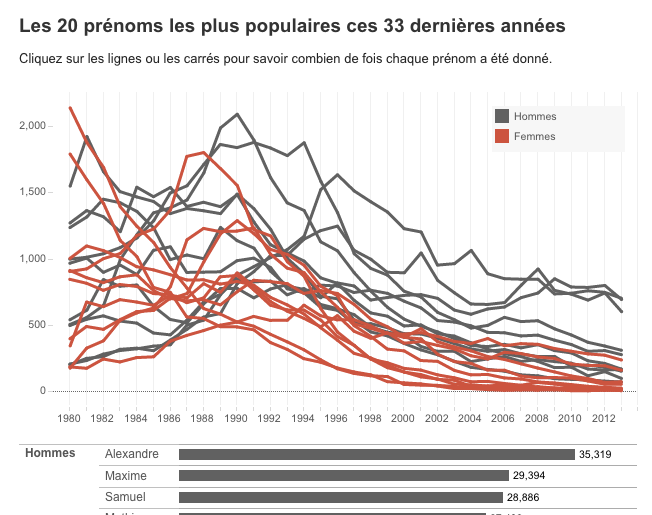
Combien de personnes s’appellent comme vous?
Florent Daudens, ICI Radio-Canada
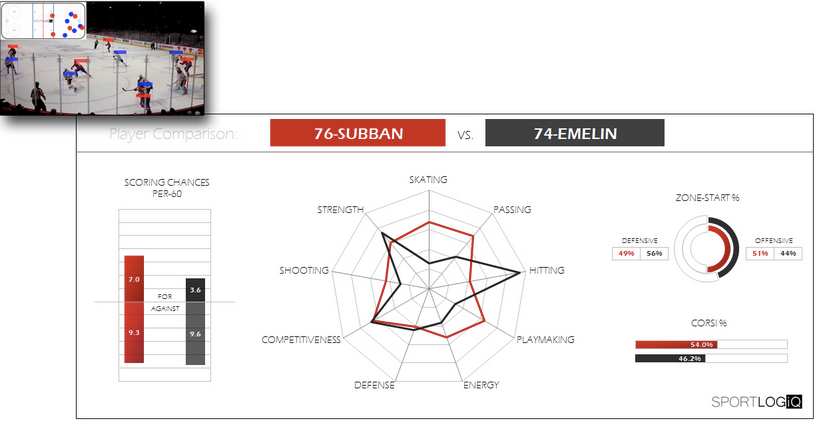
Hockey Player Tracking
Craig Buntin, SportLogIQ
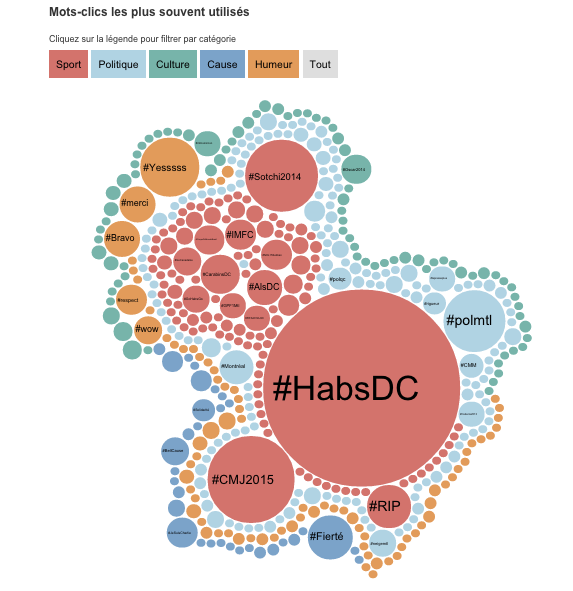
Denis Coderre, un maire et ses 140 caractères
Marie-Ève Tremblay, ICI Radio-Canada
⁂
Follow Nicolas
More Data Visualization
© Nicolas Kruchten 2010-2025