Statsd, Graphite and Nagios

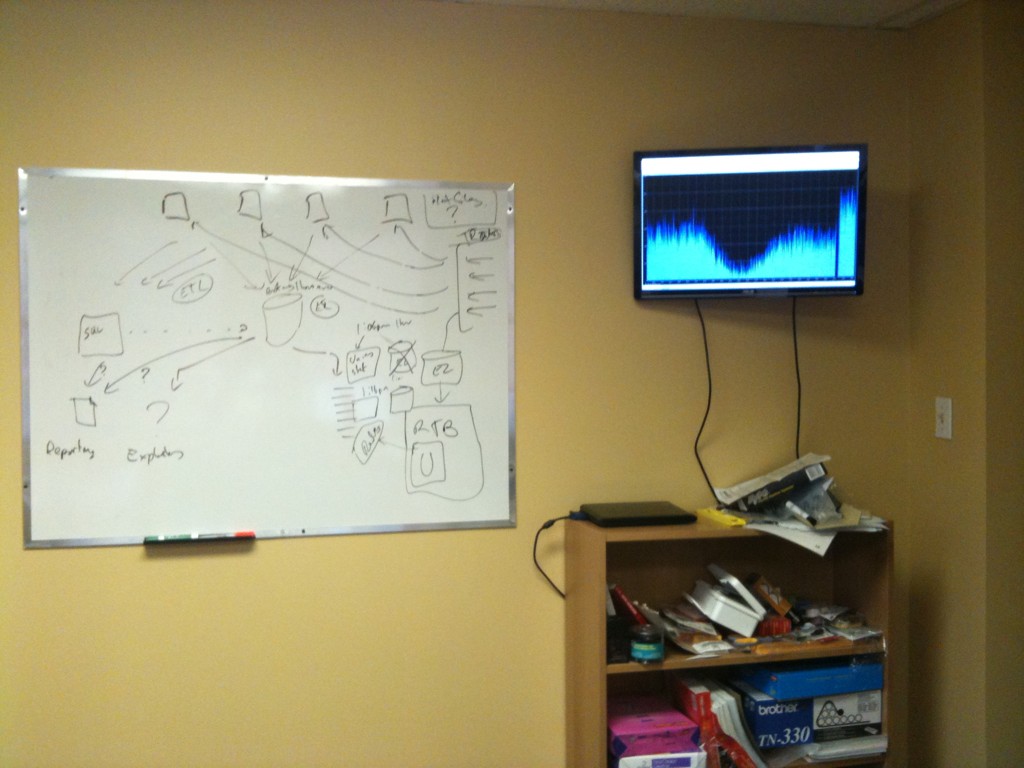
At Datacratic we tend to worship, like Etsy (and AppNexus!), at the Church of Graphs. We've even started using Statsd, the system they've released to collect stats and relay them to Carbon for display in Graphite. And by display, I mean display on a dashboard visible to the entire dev team at the office, as seen above! Statsd is a very simple system to which you can send UDP messages about various stats you want to track, which it then aggregates and passes along to Carbon, which stores them in Whisper, Graphite's back-end data store. That's a lot of moving parts but it works very well. Sending stats to statsd is extremely easy from any language (we do it from Javascript and C++) and carries low overhead, which is key for the type of work we do.

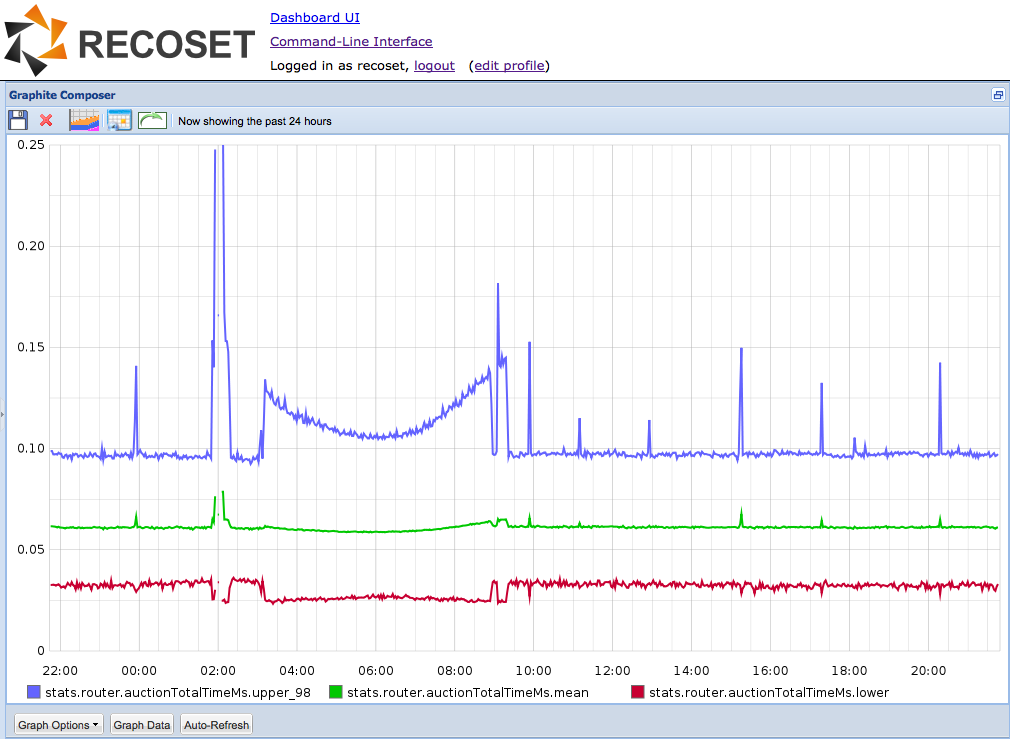
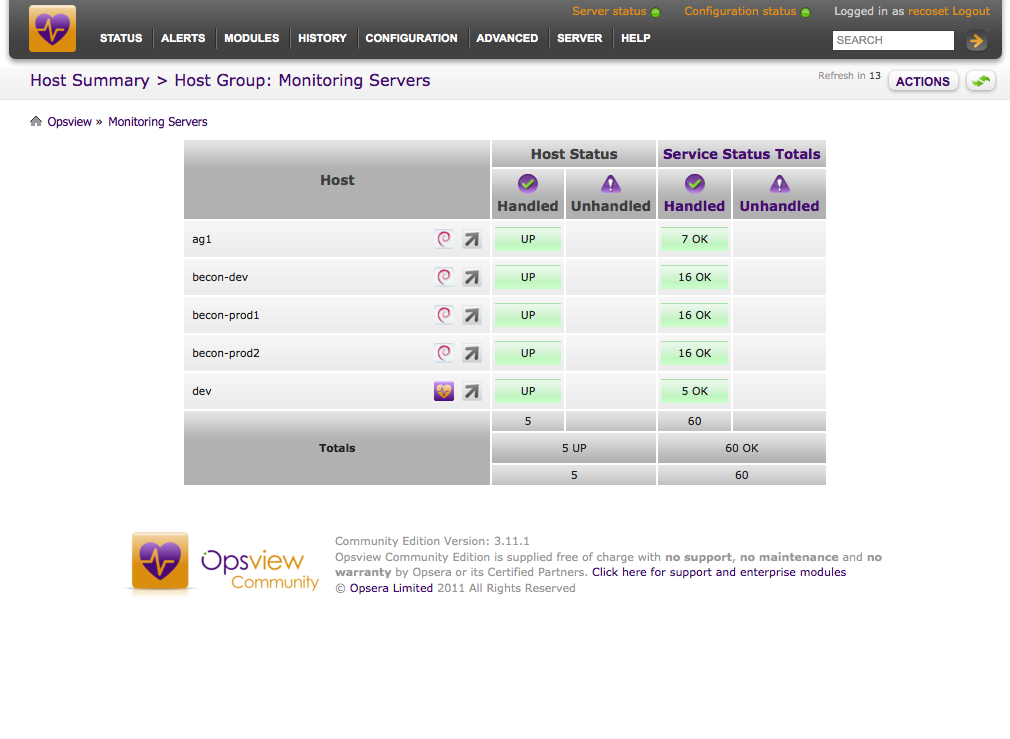
Graphite is basically a Django web app with a few different fancy front-ends to their "/render" URL, which returns lovely graphs depending on the query string, like you see above. There's the 'composer' GUI interface, which is a point-and-click graph builder, as well as a web-based command line interface which can be scripted to generate lots of graphs quickly. If you tack on "rawData=true" to the query-string you pass to what they call the URL API, you get what you'd expect: the raw data that would have been used to generate a graph had that parameter not been set. Now our dashboard doesn't just show Graphite graphs, it cycles through multiple Firefox tabs (using the Tab Slideshow plugin) one of which is Opsview, which is a web front-end to the monitoring tool Nagios. We use Nagios to monitor a variety of systems, and to notify us if something goes wrong. Here's a screenshot of Opsview telling us Nagios found nothing wrong and everything is great:

You can probably see where this is going: since we're already shuttling stats to Graphite, and we want to use Nagios for alarming, and Graphite has this rawData mode... I built a generic little Nagios plugin called check_graphite which can be used to create Nagios service-checks so that it can monitor stats in Graphite and fire off alarms if needed. This was made pretty trivial by the excellent Nagaconda python module, but the end result is pretty powerful. We can now very easily set Nagios alarms on any stat we send to Graphite through Statsd, just by creating a service-check that contains the right query-string.
The check_graphite code is available on github under an MIT license.
Update Aug 2011: for some of our most frequent stats we now bypass statsd and instead aggregate counters at their point of origin to send directly to Carbon, which is Graphite's back-end. This cuts down on UDP messages and CPU usage considerably when sending tens of thousands of messages per second from one process through statsd
Update Aug 2012: we actually use Zabbix rather than Nagios/Opsview for our monitoring and alarming now, as it's more flexible/feature-rich.
⁂