
Nicolas Kruchten
is a data visualization specialist
based in Montreal, Canada.
Pivot Table of All 2017 Montreal Election Results
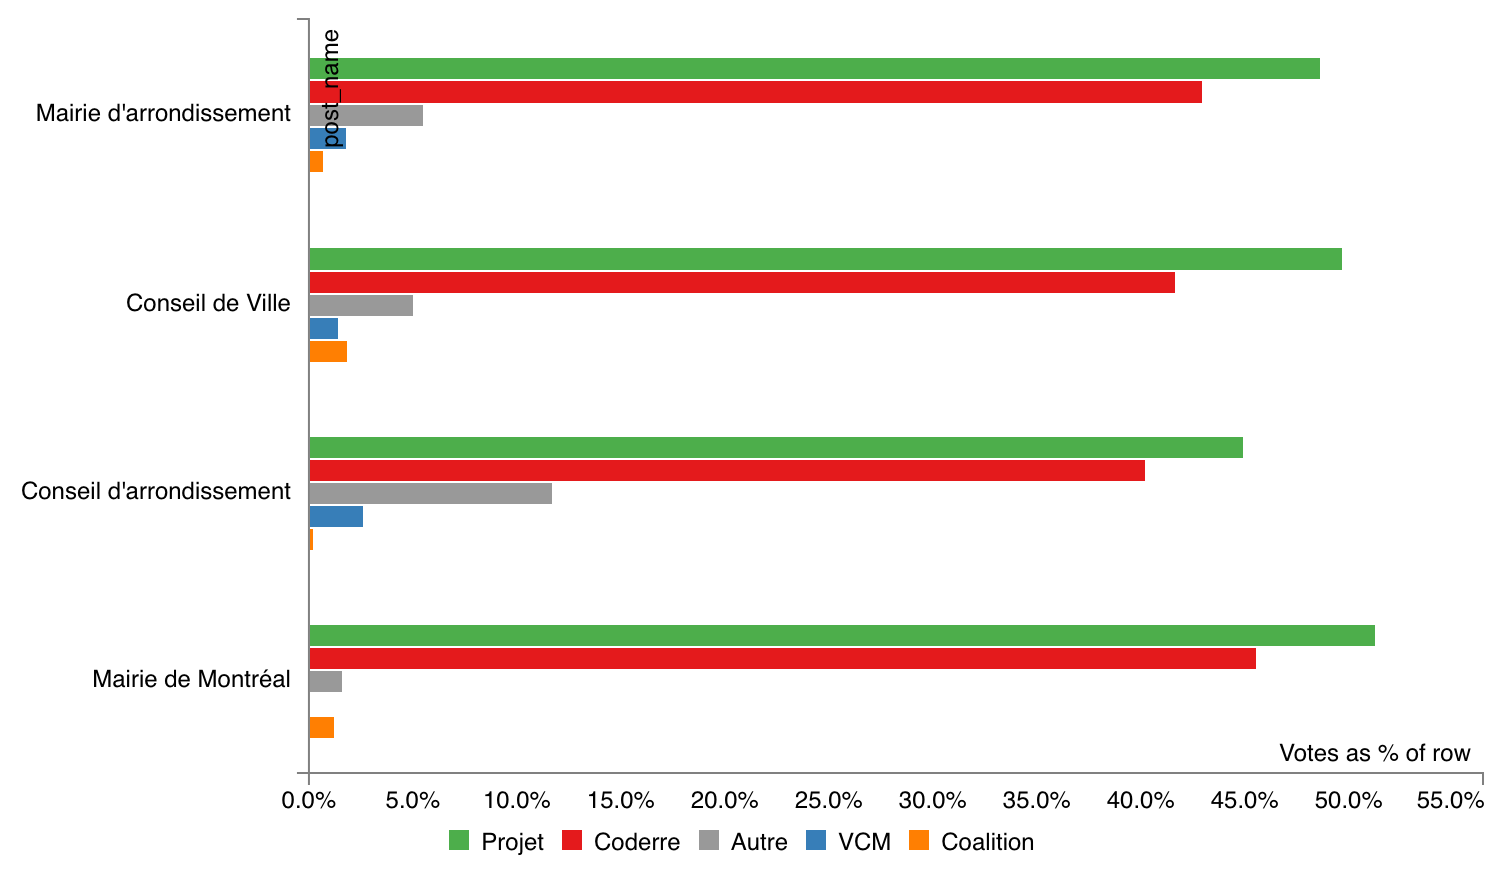
Many people reacted to my my interactive map of Montreal election results with requests for tables of hard numbers, and I’m happy to oblige! I grabbed the official election results from the Montreal open data portal and aggregated them by district to produce an easy-to-use CSV file. I also created a page that preloads a PivotTable.js instance with the data, for interactive data exploration fun!
Map of All 2017 Montreal Election Results
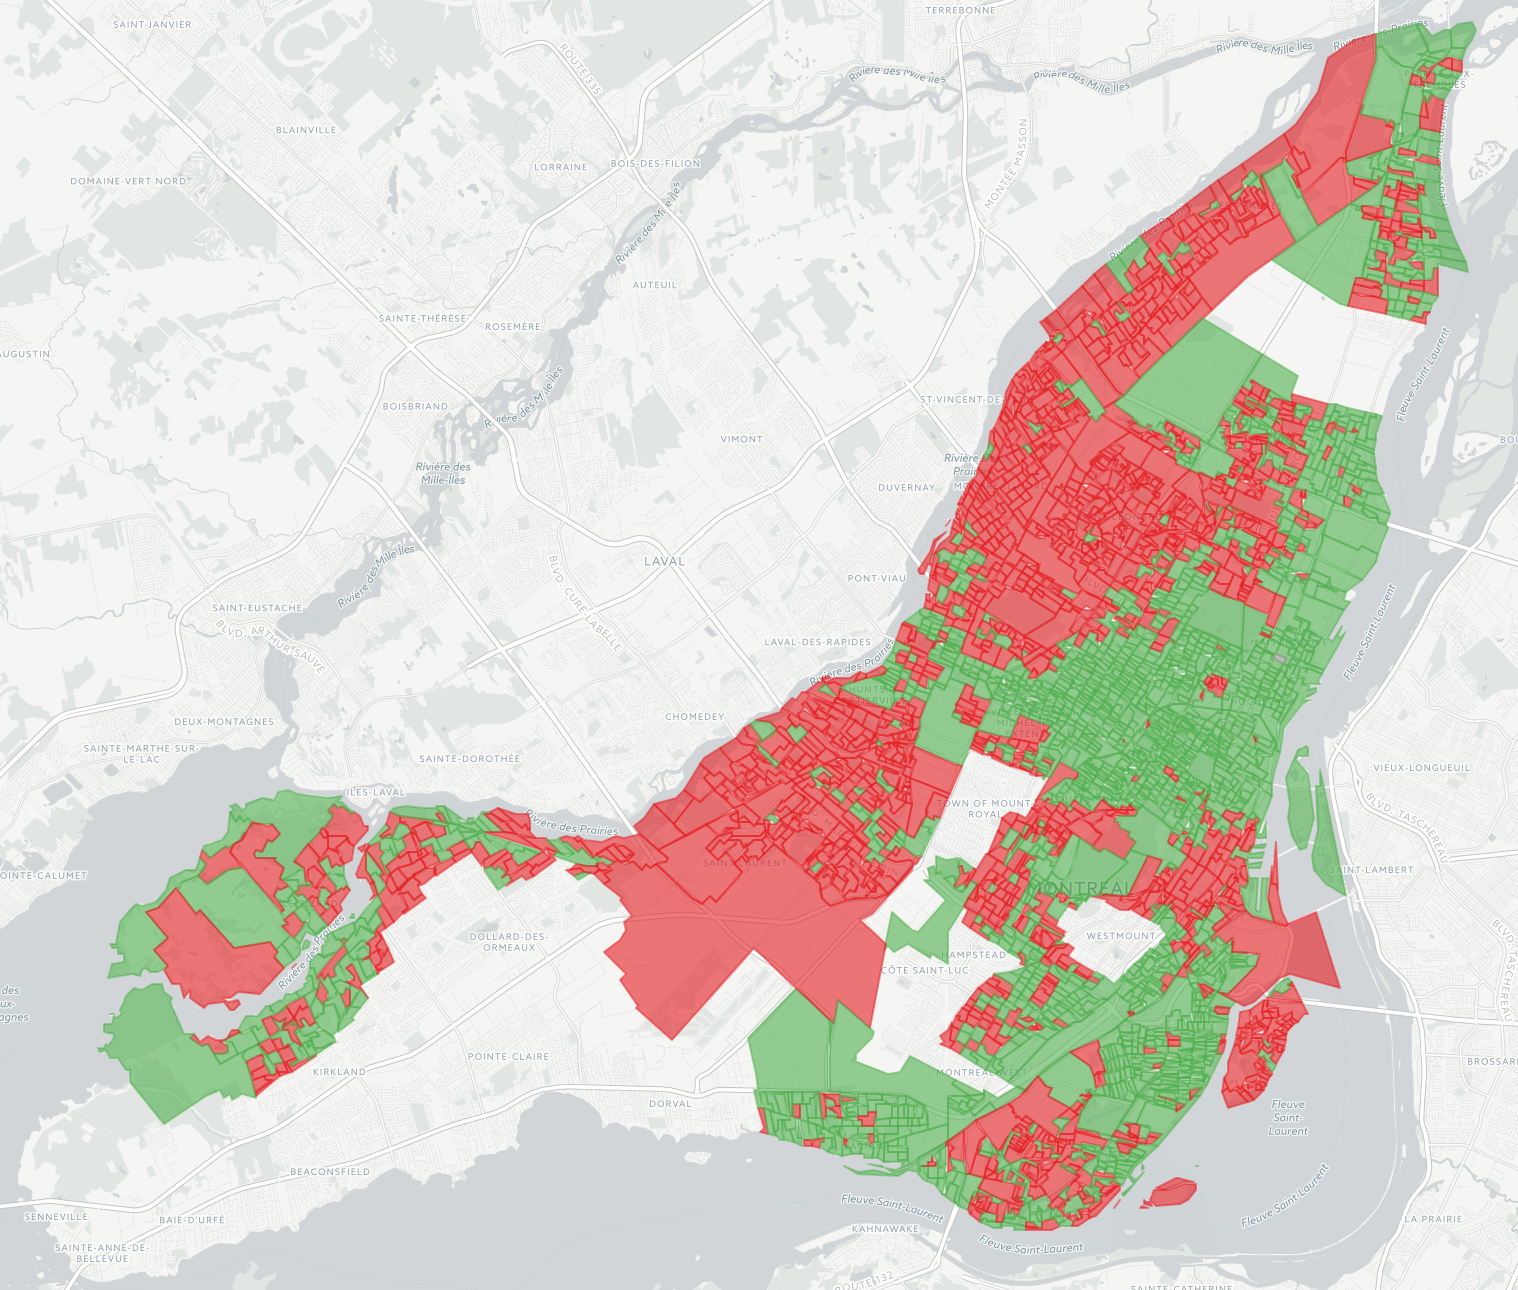
The 2017 edition of my interactive map of Montreal election results is now available, and I’m so pleased about the results it shows! In 2013 I made a map a couple of months after the election and it was considered so unusual it was talked about on the radio. But times have changed: this time the data was available within days, and within hours of that, news outlets had similar maps on their websites. I still like mine better though because it shows data from all 103 races, rather than just the mayoralty. The 2013 map is still around, for reference.
Interview on Using Reflection Podcast
My friend Mark Weiss recently started a podcast called Using Reflection and I was pleased to be interviewed as a guest on his 6th episode. We had a great chat about datavis and engineering ethics, among other topics.
The Feedback Log: My Product Owner Workflow
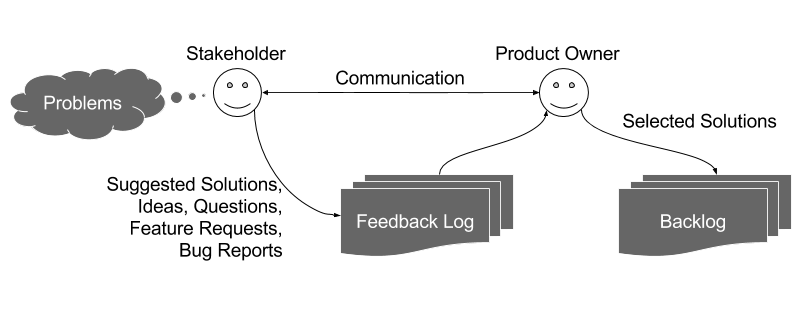
In an agile software development project, the role of the product owner comes with the responsibily of managing the product backlog. Most popular definitions of the backlog are quite broad, encouraging product owners to include in it every feature request, bugfix, idea related to the product etc. I have found it more helpful, however, to distinguish between backlog items on the one hand (i.e. changes that as a product owner I intend to be made to the product) and feedback items on the other (i.e. bug reports, feature requests, ideas etc.)
Université de Montréal: Introduction to Data Visualization
I recently did a guest lecture (in French!) at the Université de Montréal in the context of the École d’été en Architecture de l’information (Summer program for Information Architecture).
Mapping Car2Go Vehicle Availability in Montreal
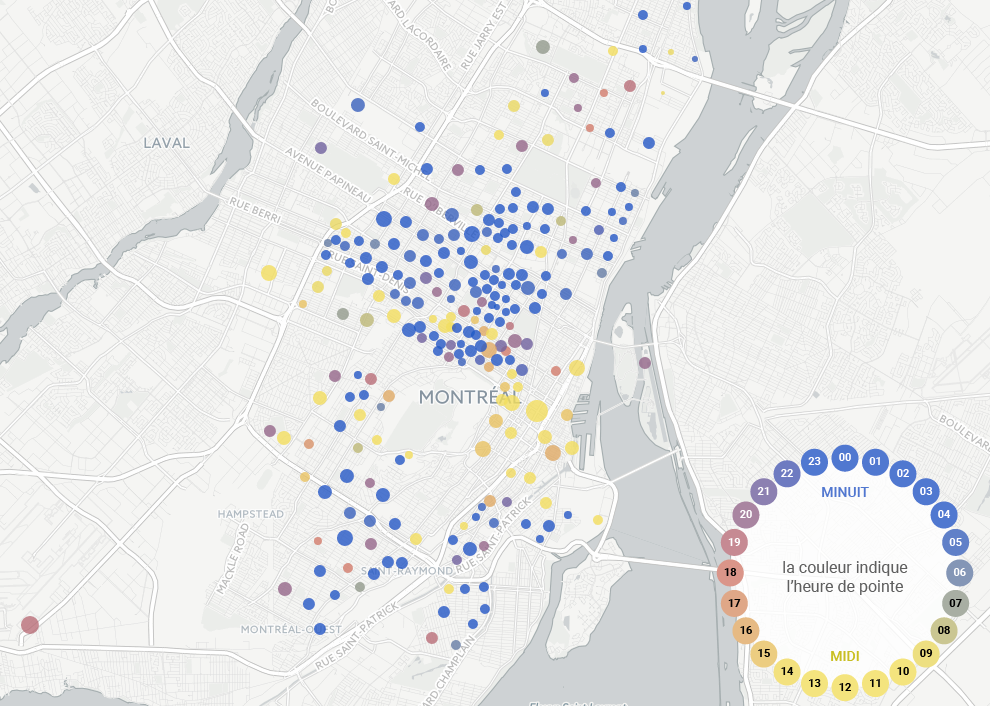
As part of my second collaboration with data journalist Roberto Rocha, I made an interactive map for his recent piece on where and when Car2Go vehicles park in Montreal (shorter english version). Earlier in the year, Roberto told me about people in certain neighbourhoods complaining about Car2Go vehicles causing parking problems. He and I hit upon the idea of querying Car2Go’s API every few minutes to find out where all their available cars were parked in Montreal, to take a look at some real data on this issue. I’m a huge fan and user of car-sharing services and in my neighbourhood of Rosemont I feel they prevent parking problems by enabling lower car ownership. As my map makes clear, however, this is not the case in areas like the Mile End. In any case, the CBC articles do a great job of reporting on the situation, and I wanted to share some of the thinking and code that went into making the map.
Notes on metro platform wayfinding
After my photographic metro platform maps went viral last week, I received a lot of feedback in the form of emails and comments, telling me about the experiences of subway riders in other cities. Here are some interesting vignettes.
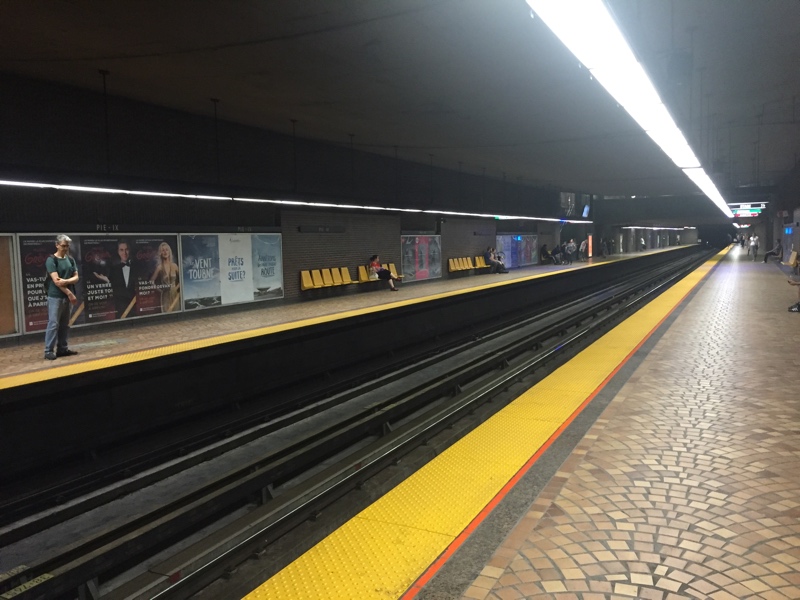
Direction Angrignon: a different kind of subway map
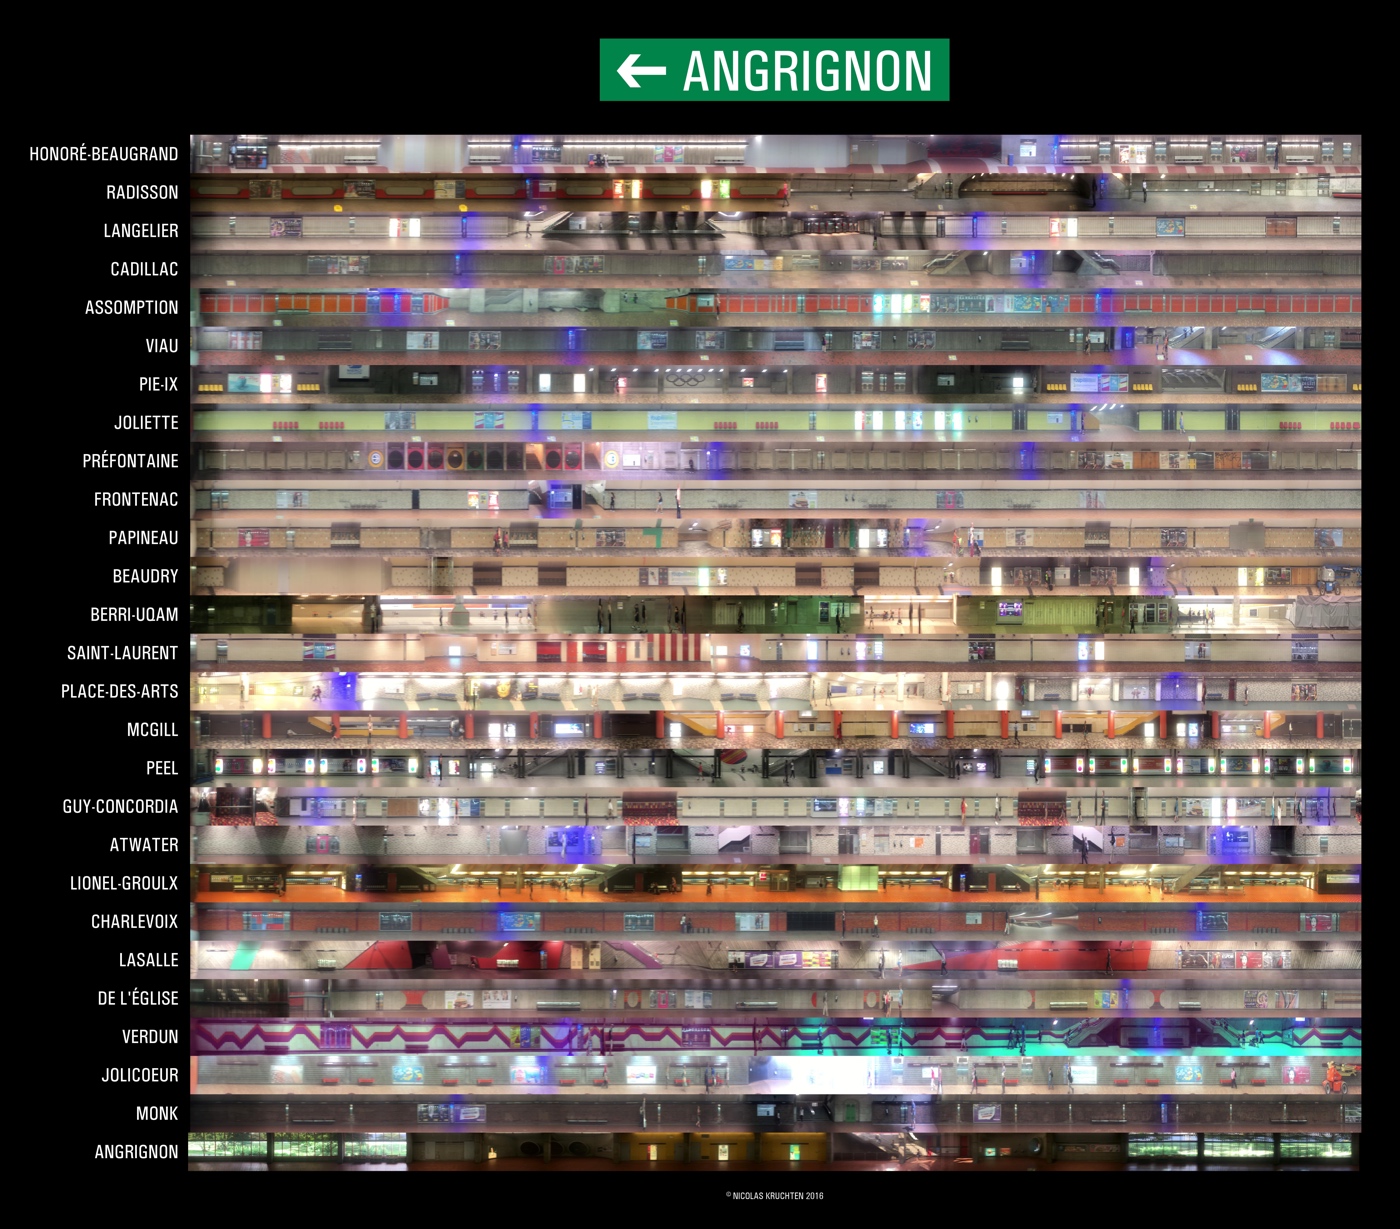
The photo above (click here for a zoomable version) is a collage of panoramic scans of the Angrignon-bound platforms of the Montreal metro’s green line. I used my phone to record videos from the rear-most window of the train and wrote a bit of software to stitch the frames together. My goal was to create a way to figure out where to stand while waiting for the metro so as to get out closest to where you want to go at your destination, and I used these scans to build a little interactive comparison page for just this purpose.
VisMtl: Graph Visualization vs Dimensionality Reduction
Visualizing datasets as circle-and-arrow networks or graphs is a popular and easy way to make attention-grabbing graphics. As the number of data points grows, however, these graphics become crowded and marginally useful. Dimensionality-reduction algorithms such as t-SNE represent a different approach to visualizing the relationships between large numbers of data points, which in certain cases can produce graphics which do not suffer from the same types of problems as graph-visualization approaches. In this talk I compare and contrast the two approaches and give pointers to those who wish to try them out.
Machine Learning Meets Economics, Part 2
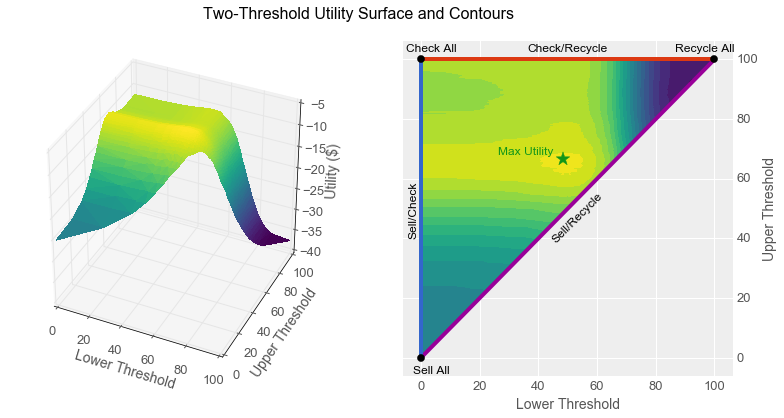
By using machine learning algorithms, we are increasingly able to use computers to perform intellectual tasks at a level approaching that of humans. Given that computers cost less than employees, many people are afraid that humans will therefore necessarily lose their jobs to computers. Contrary to this belief, in this article I show that even when a computer can perform a task more economically than a human, careful analysis suggests that humans and computers working together can sometimes yield even better business outcomes than simply replacing one with the other.
Specifically, I show how a classifier with a reject option can increase worker productivity for certain types of tasks, and I show how to construct and tune such a classifier from a simple scoring function by using two thresholds. I begin with a parable featuring the same characters as the one from Part 1 of this Machine Learning Meets Economics series. I recommend reading Part 1 first, as it sets up much of the terminology I use here.