
Nicolas Kruchten
is a data visualization specialist
based in Montreal, Canada.
Machine Learning Meets Economics, Part 2
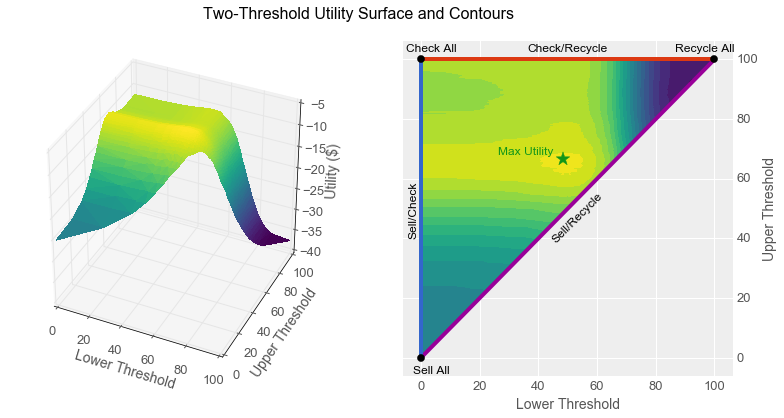
By using machine learning algorithms, we are increasingly able to use computers to perform intellectual tasks at a level approaching that of humans. Given that computers cost less than employees, many people are afraid that humans will therefore necessarily lose their jobs to computers. Contrary to this belief, in this article I show that even when a computer can perform a task more economically than a human, careful analysis suggests that humans and computers working together can sometimes yield even better business outcomes than simply replacing one with the other.
Specifically, I show how a classifier with a reject option can increase worker productivity for certain types of tasks, and I show how to construct and tune such a classifier from a simple scoring function by using two thresholds. I begin with a parable featuring the same characters as the one from Part 1 of this Machine Learning Meets Economics series. I recommend reading Part 1 first, as it sets up much of the terminology I use here.
BIG 2016: The Machine Learning Database
I presented MLDB today at the BigData Innovators Gathering (BIG) 2016 conference.
Concordia: Applied Auction Theory in Online Advertising
I was recently invited to give a talk about auction theory and online advertising at Concordia University for a course entitled Social and Information Networks, which uses a really interesting textbook called Networks, Crowds, and Markets.
HTML5mtl: PivotTable.js, an Open-Source Story
I was recently invited to give a talk at HTML5mtl, and I chose to speak about my experiences with open-sourcing PivotTable.js.
Machine Learning Meets Economics
The business world is full of streams of items that need to be filtered or evaluated: parts on an assembly line, resumés in an application pile, emails in a delivery queue, transactions awaiting processing. Machine learning techniques are increasingly being used to make such processes more efficient: image processing to flag bad parts, text analysis to surface good candidates, spam filtering to sort email, fraud detection to lower transaction costs etc.
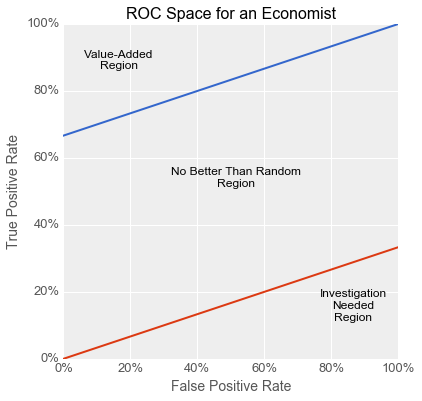
In this article, I show how you can take business factors into account when using machine learning to solve these kinds of problems with binary classifiers. Specifically, I show how the concept of expected utility from the field of economics maps onto the Receiver Operating Characteristic (ROC) space often used by machine learning practitioners to compare and evaluate models for binary classification. I begin with a parable illustrating the dangers of not taking such factors into account. This concrete story is followed by a more formal mathematical look at the use of indifference curves in ROC space to avoid this kind of problem and guide model development. I wrap up with some recommendations for successfully using binary classifiers to solve business problems.
JS Open Day Mtl: JavaScript for Data Visualization
I was excited to be invited to give a talk at the JavaScript Open Day Montreal about data visualization in JavaScript.
Montreal R User Group: ggplot2 & rpivotTable
I recently gave a talk at the Montreal R User Group about my favourite data visualization library, ggplot2, as well as rpivotTable, the R interface to my own PivotTable.js
As you can see in the video above, during the talk I just scrolled through an R file in RStudio. What you see below is the result of slightly modifying that file and running it through the RMarkdown process to capture the output.
PyCon Canada: Make Jupyter even more magical with cell magic extensions!
I went back to my alma mater at the University of Toronto to give a talk at PyCon Canada on how to make Jupyter even more magical than it already is with cell magic extensions.
Big Data Montreal: the Machine Learning Database
I was happy to oblige when I was invited to give a talk at Big Data Montreal about the project I work on at Datacratic: the Machine Learning Database (MLDB).
Drag'n'Drop Pivot Tables and Charts, in Jupyter/IPython Notebook
PivotTable.js is a Javascript Pivot Table and Pivot Chart library with drag’n’drop interactivity, and it can now be used with Jupyter/IPython Notebook via the pivottablejs module. This has been possible for RStudio users for a while now via rPivotTable, but why should they have all the fun?