Plotly.js and Crossfilter.js
I recently put together a simple example of Plotly.js and Crossfilter.js working together to produce a set of linked data visualizations.
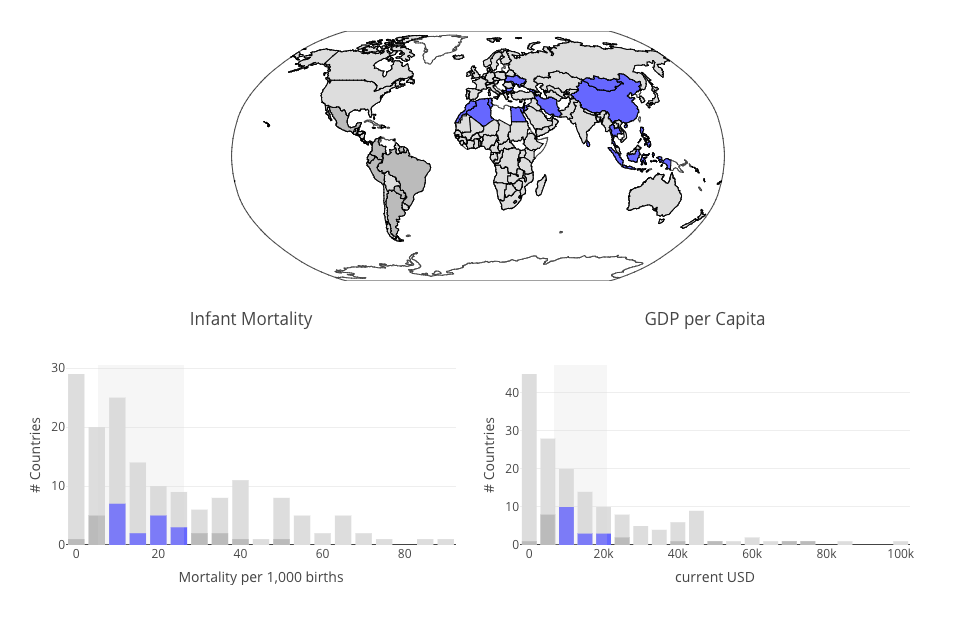
One neat little innovation I came up with for this demo was the two different shades of grey to indicate not only that some data is being filtered out but a partial explanation of why. Light grey means that the data is being filtered out by the filters in one of the other vis panels, whereas dark grey means that the data is being filtered out by the local filter.
⁂
Follow Nicolas
Code on Github
Code from this post is up on Github at plotly/plotly.js-crossfilter.js
More Data Visualization
© Nicolas Kruchten 2010-2026