VisMtl: Graph Visualization vs Dimensionality Reduction
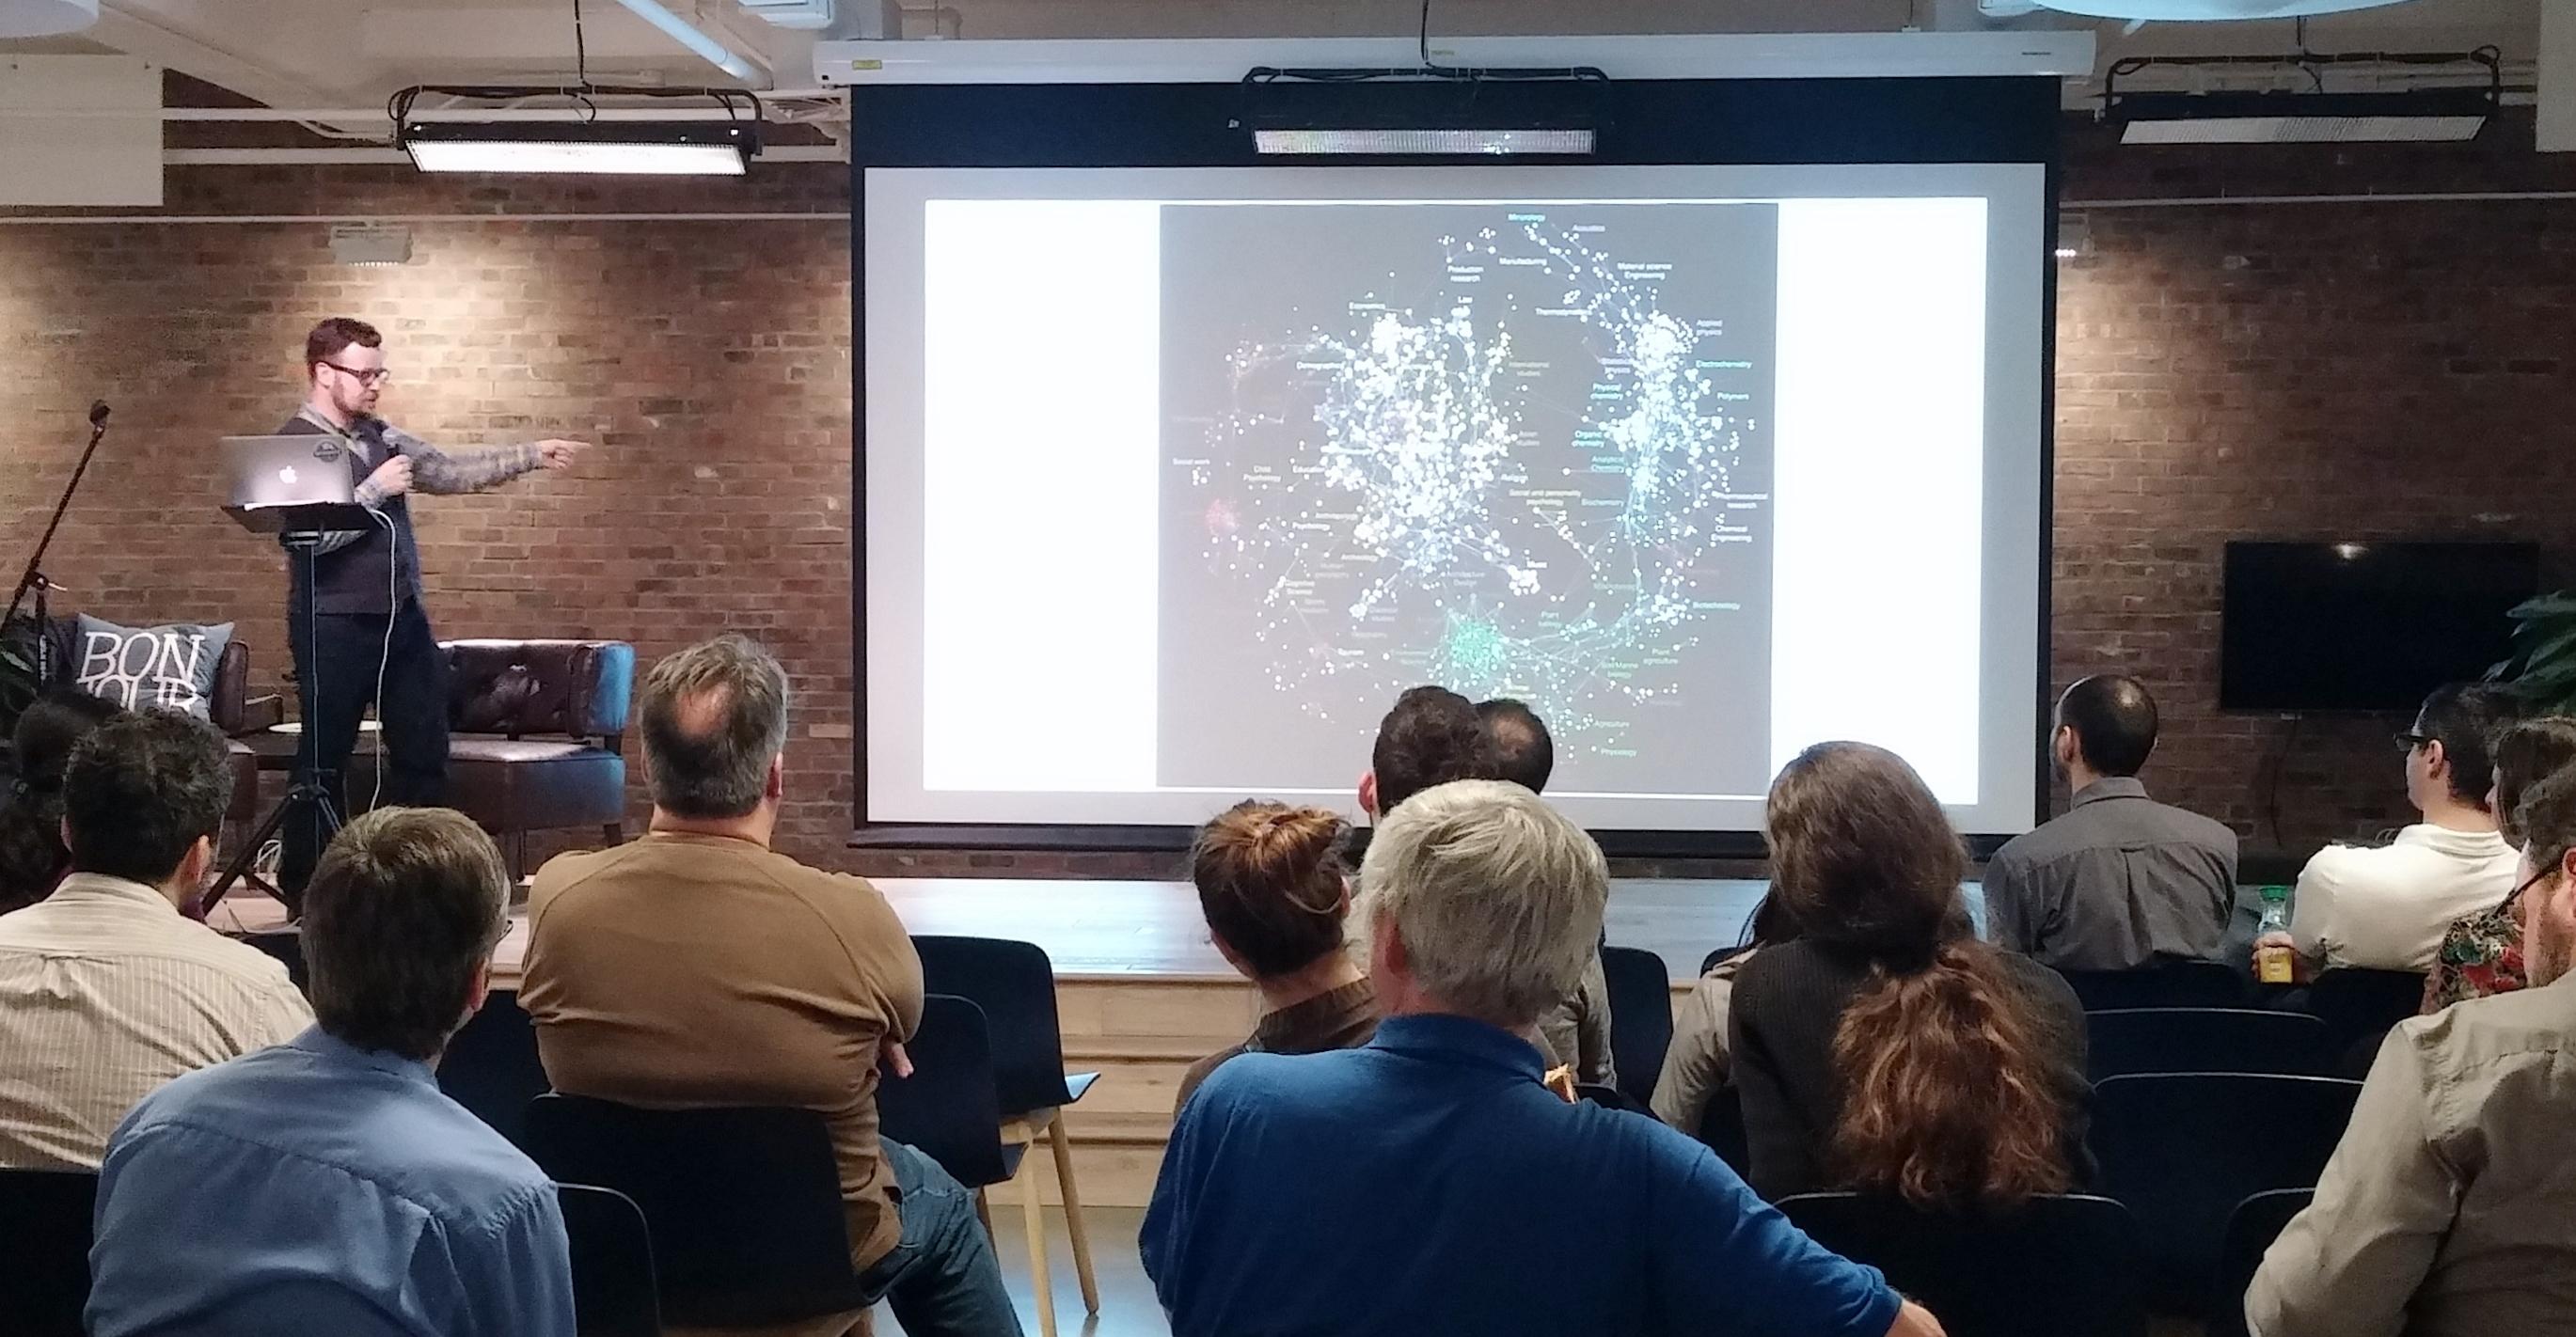
Visualizing datasets as circle-and-arrow networks or graphs is a popular and easy way to make attention-grabbing graphics. As the number of data points grows, however, these graphics become crowded and marginally useful. Dimensionality-reduction algorithms such as t-SNE represent a different approach to visualizing the relationships between large numbers of data points, which in certain cases can produce graphics which do not suffer from the same types of problems as graph-visualization approaches. In this talk I compare and contrast the two approaches and give pointers to those who wish to try them out.
⁂
Follow Nicolas
More Talks
© Nicolas Kruchten 2010-2026