
Nicolas Kruchten
is a data visualization specialist
based in Montreal, Canada.
Talks
I like to give talks about my personal and professional interests, and I try to record them and post them here, whenever possible. If you would like me to give a talk at an event, please reach out!
Montreal Python: A Fresh Look at the Python Data Visualization Landscape
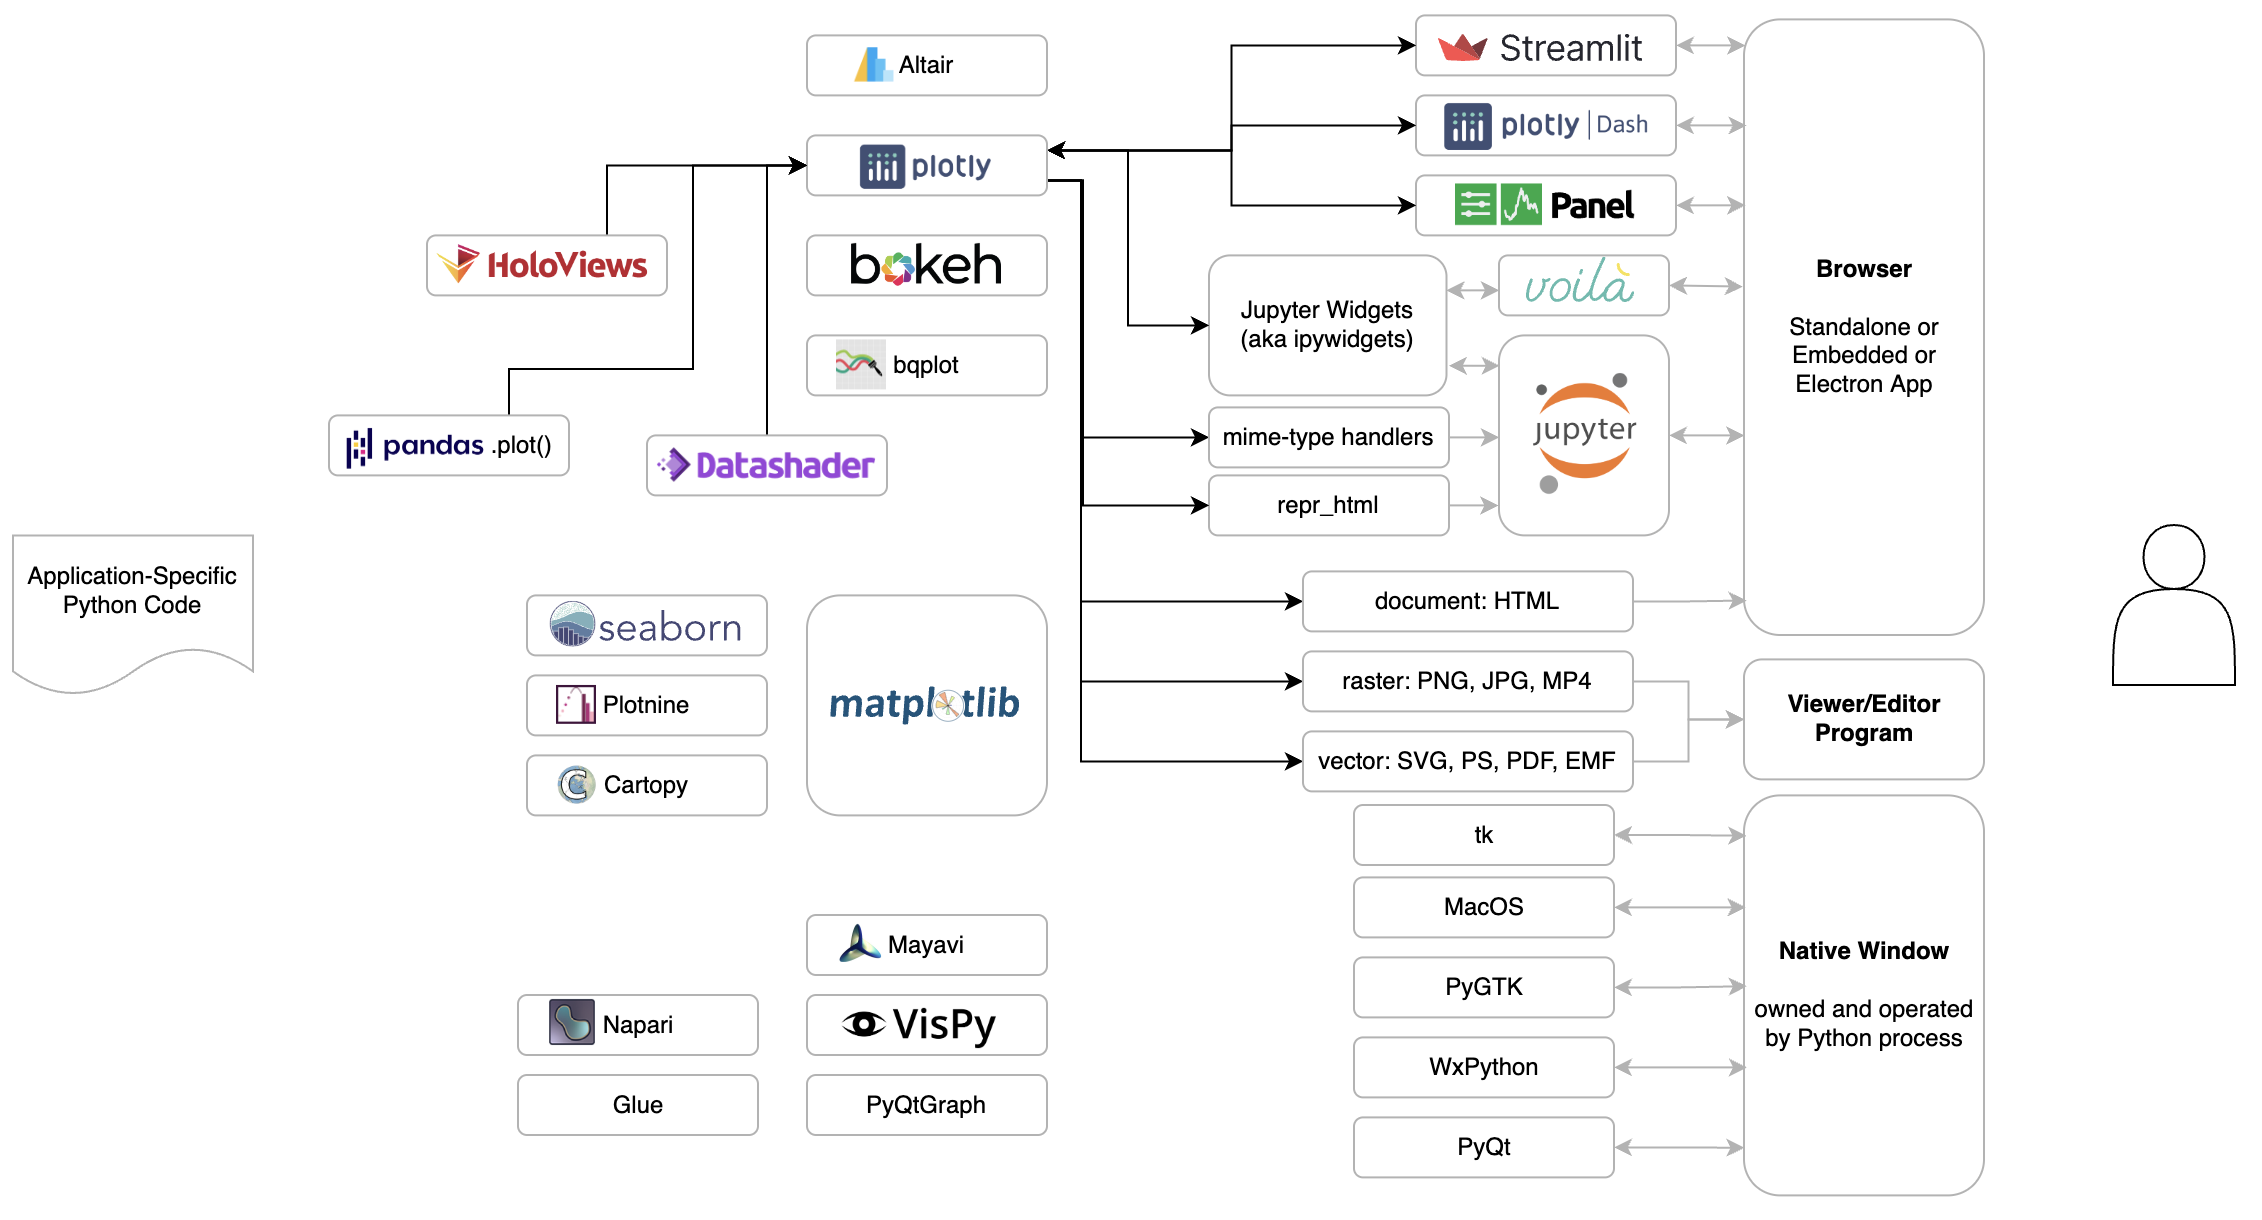
I gave a talk at Montreal Python where I showed a diagram I’ve been working on to capture and explain how the various pieces of the Python data visualization landscape fit together. My presentation is first, starting about 7 minutes into the video.
Deliver Advanced Analytics Faster with Dashboard Engine
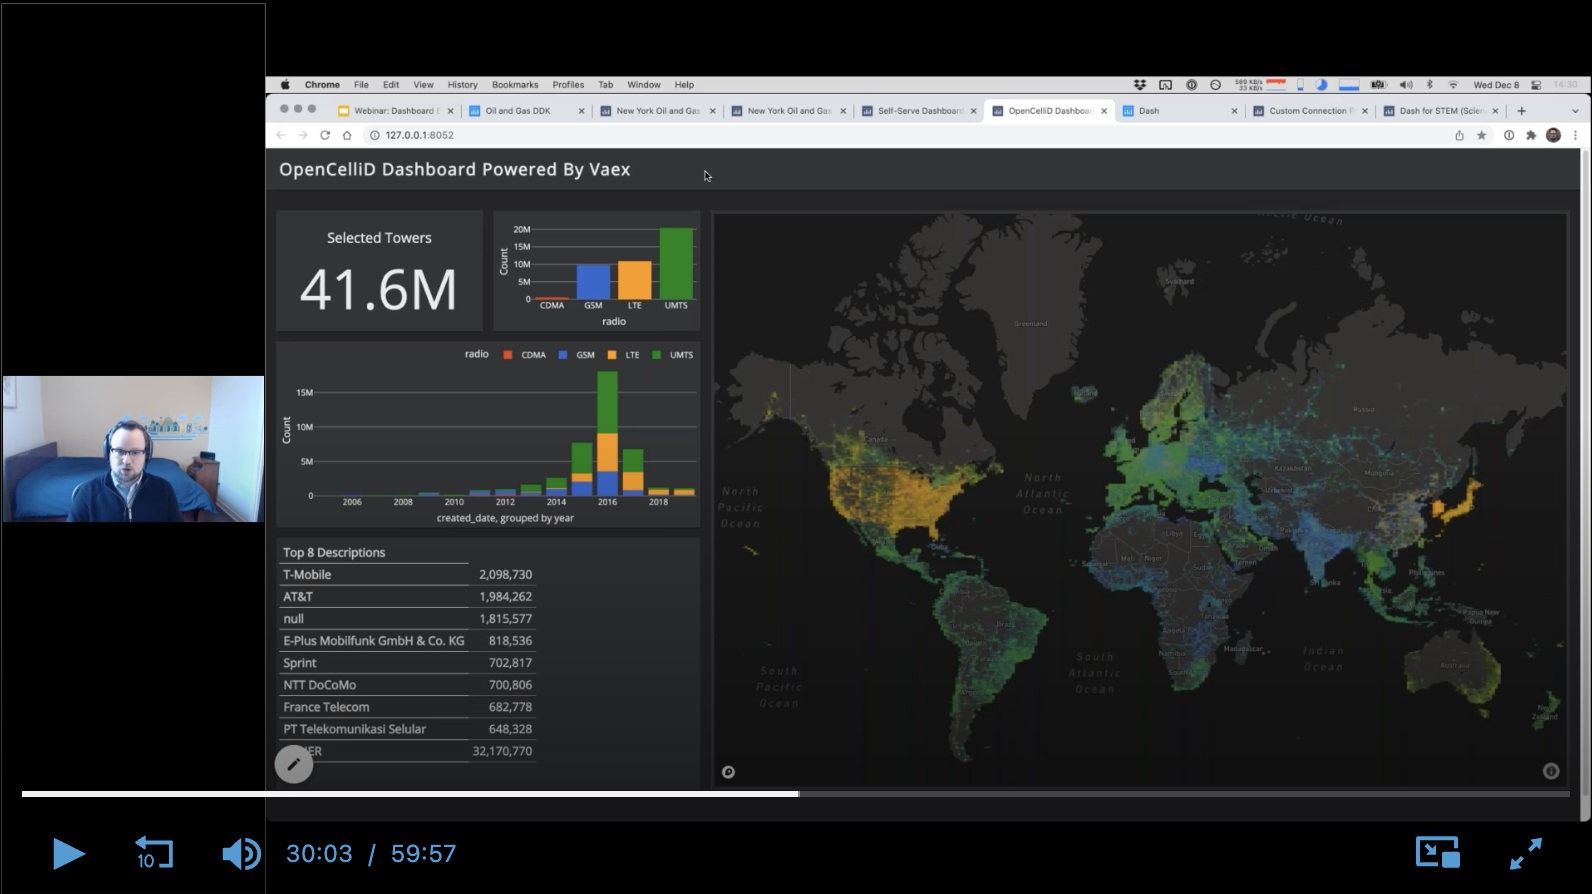
I gave a full-length webinar (name & email required to access, sorry!) about Dashboard Engine, the product my team and I have been working on for 2 years.
PyData Global 2021: Python Dashboarding Shootout and Showdown
I was on a panel at PyData Global 2021 where folks representing various Python “dashboarding” frameworks compared and contrasted their work with Dash, which I represented.
PyData Global 2021: Why Interactive Data Visualization Matters for Data Science in Python
I gave a talk at PyData Global 2021 that pulls together some ideas about why interactive data visualization matters into what I hope is an interesting and useful framework.
IEEE VIS 2021: VisInPractice Panel on Tools of the Trade
I participated in a panel called Tools of the Trade at the 2021 VisInPractice event, part of IEEE VIS 2021.
Introducing Dashboard Engine
I was very proud to introduce Dashboard Engine to the world, as part of the Dash Enterprise 5.0 announcement webinar. I’ve been the product manager and team leader for this project for 18 months and it’s really gratifying to see it come to fruition.
SciPy 2021: Data Visualization as the First and Last Mile of Data Science
I was proud to be able to give a talk at SciPy 2021 this year, about Plotly Express and Dash!
Interview on IQT Podcast
I was recently interviewed on the IQT Podcast about Visualizing Data During a Pandemic, and how Plotly is contributing to COVID-19 response.
SciPy 2020: Tools Plenary Session
I was pleased to give a three-minute rundown at SciPy 2020 about what the Plotly.py team has been up to! My bit is at timecode 8:25.
Polytechnique Montréal: Plotly Express & Dash
I was happy to be invited back for a third time to talk about Plotly during Professor Thomas Hurtut's data visualization class at Polytechnique Montréal (in English this time!).
Polytechnique Montréal: Plotly Express & Dash (en français)
I was happy to be invited back to talk about Plotly during Professor Thomas Hurtut's data visualization class at Polytechnique Montréal (in French).
Montreal Python: Plotly Express and Dash
I recently gave a talk about Plotly Express and Dash at Montreal Python. The description of the talk was, "You start the morning exploring some data in a Jupyter notebook with Plotly Express and after lunch you whip up a web application to give your non-programmer colleagues access to those same insights with Dash, all in under a 100 lines of Python, no Javascript required. This talk will show you how Plotly's open-source libraries fit together to make this possible."
Polytechnique Montréal: Intro to Plotly
I was happy to be invited to talk about Plotly during Professor Thomas Hurtut's data visualization class at Polytechnique Montréal (in French).
DSDT MTL: Intro to Dash
I gave a talk at the Data Science, Design and Technology Montreal meetup which was a lot of fun, especially when other members of the community presented the apps that they'd created with Dash!
Software Product and/or Professional Services Organizations
I recently did a guest talk at the Arup Montreal office regarding the differences between Software Product Organizations and Professional Services Organizations.
Interview on Using Reflection Podcast
My friend Mark Weiss recently started a podcast called Using Reflection and I was pleased to be interviewed as a guest on his 6th episode. We had a great chat about datavis and engineering ethics, among other topics.
Université de Montréal: Introduction to Data Visualization
I recently did a guest lecture (in French!) at the Université de Montréal in the context of the École d’été en Architecture de l’information (Summer program for Information Architecture).
VisMtl: Graph Visualization vs Dimensionality Reduction
Visualizing datasets as circle-and-arrow networks or graphs is a popular and easy way to make attention-grabbing graphics. As the number of data points grows, however, these graphics become crowded and marginally useful. Dimensionality-reduction algorithms such as t-SNE represent a different approach to visualizing the relationships between large numbers of data points, which in certain cases can produce graphics which do not suffer from the same types of problems as graph-visualization approaches. In this talk I compare and contrast the two approaches and give pointers to those who wish to try them out.
BIG 2016: The Machine Learning Database
I presented MLDB today at the BigData Innovators Gathering (BIG) 2016 conference.
Concordia: Applied Auction Theory in Online Advertising
I was recently invited to give a talk about auction theory and online advertising at Concordia University for a course entitled Social and Information Networks, which uses a really interesting textbook called Networks, Crowds, and Markets.
HTML5mtl: PivotTable.js, an Open-Source Story
I was recently invited to give a talk at HTML5mtl, and I chose to speak about my experiences with open-sourcing PivotTable.js.
JS Open Day Mtl: JavaScript for Data Visualization
I was excited to be invited to give a talk at the JavaScript Open Day Montreal about data visualization in JavaScript.
Montreal R User Group: ggplot2 & rpivotTable
I recently gave a talk at the Montreal R User Group about my favourite data visualization library, ggplot2, as well as rpivotTable, the R interface to my own PivotTable.js
As you can see in the video above, during the talk I just scrolled through an R file in RStudio. What you see below is the result of slightly modifying that file and running it through the RMarkdown process to capture the output.
PyCon Canada: Make Jupyter even more magical with cell magic extensions!
I went back to my alma mater at the University of Toronto to give a talk at PyCon Canada on how to make Jupyter even more magical than it already is with cell magic extensions.
Big Data Montreal: the Machine Learning Database
I was happy to oblige when I was invited to give a talk at Big Data Montreal about the project I work on at Datacratic: the Machine Learning Database (MLDB).
MTL Data: Montreal 311 Service Requests, an Analysis
Earlier this year, I collaborated with a reporter from the Montreal Gazette to analyze a dataset containing information about 1.4 million service requests received by the City of Montreal from its citizens. The resulting article was entitled "Montreal's 311 records shed light on residents' concerns — to a point" and credits me at the bottom. I have also published my own interactive analysis of the dataset here: Montreal 311 Service Requests, an Analysis. The dataset, obtained from the city's Gestion des demandes clients (GDC) system via an Access to Information request, covered the five years from 2008 to 2012 and contained the date and a very short description for each request, and in most cases, an address. The service requests were received by the city through its 311 phone line or at service counters throughout the city.
Montreal Python: Introducing the Machine Learning Database
I recently did the first ever public demo of the product I'm working on at Datacratic: the Machine Learning Database.
VisMtl #5 Roundup
I recently organized and MC’ed the fifth Visualization Montreal meetup, and I think it was a great success! The concept was to have a series of 7-minutes-max flash presentations from Montrealers where each one would show off a single visualization project. The rules were: no slides, no tools, just one publicly available data visualization. We had 12 presenters including me, with a good mix of types of data and visualizations. Below is the list of visualizations that were presented, and you can find photos of the event here.
VisMtl: Canadian MPs 2012 Visualization
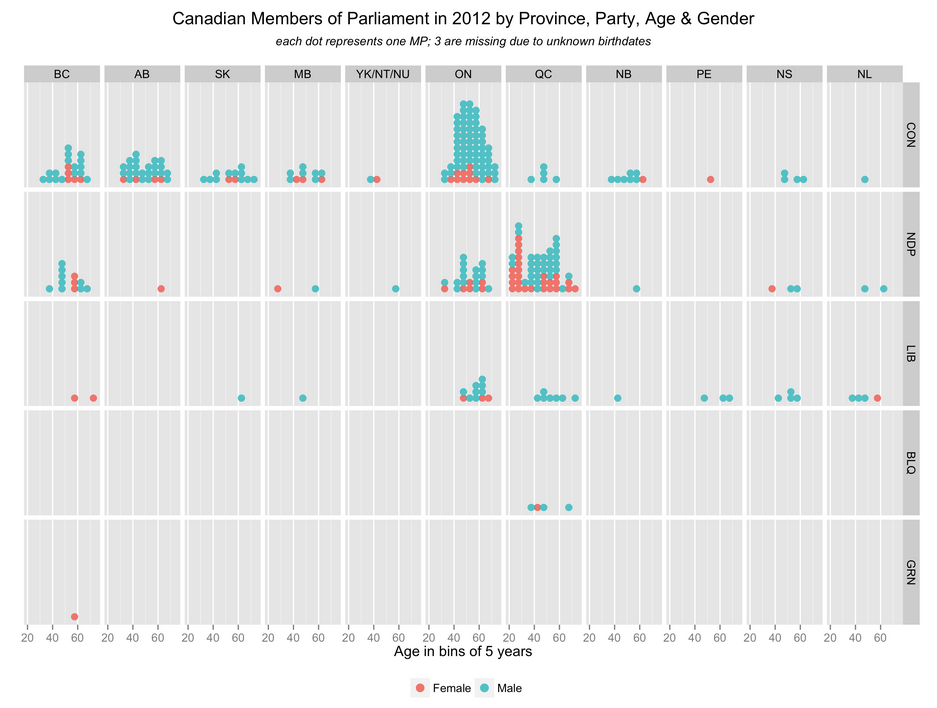
The visualization I presented at VisMtl 5 was entitled “Canadian Members of Parliament in 2012 by Province, Party, Age & Gender” and is shown above.
PAPIs.io 2014: Behind the scenes with a Predictive API
I gave a talk at in Barcelona at the PAPIs.io 2014 Predictive APIs conference last November.
Montreal Python: Unsupervised ML with scikit-learn
I gave a talk at Montreal Python on Data Science and Unsupervised Machine Learning with scikit-learn. The video is above and I posted all of my presentation materials online.
VisMtl: Maps, Tools, Stories
I gave a talk at Visualization Montréal entitled Maps, Tools, Stories. Check out the synced slides and video!
Big Data Week Montreal: From Big Data to Big Value
Video and slides from my talk at the kickoff of Big Data Week Montreal 2014.
Rubicon Tech Talk: The Algorithms Automating Advertising
I was invited to speak on a panel at a Rubicon Project product launch, and this is the video of the event.
BitNorth 2009: myEWB
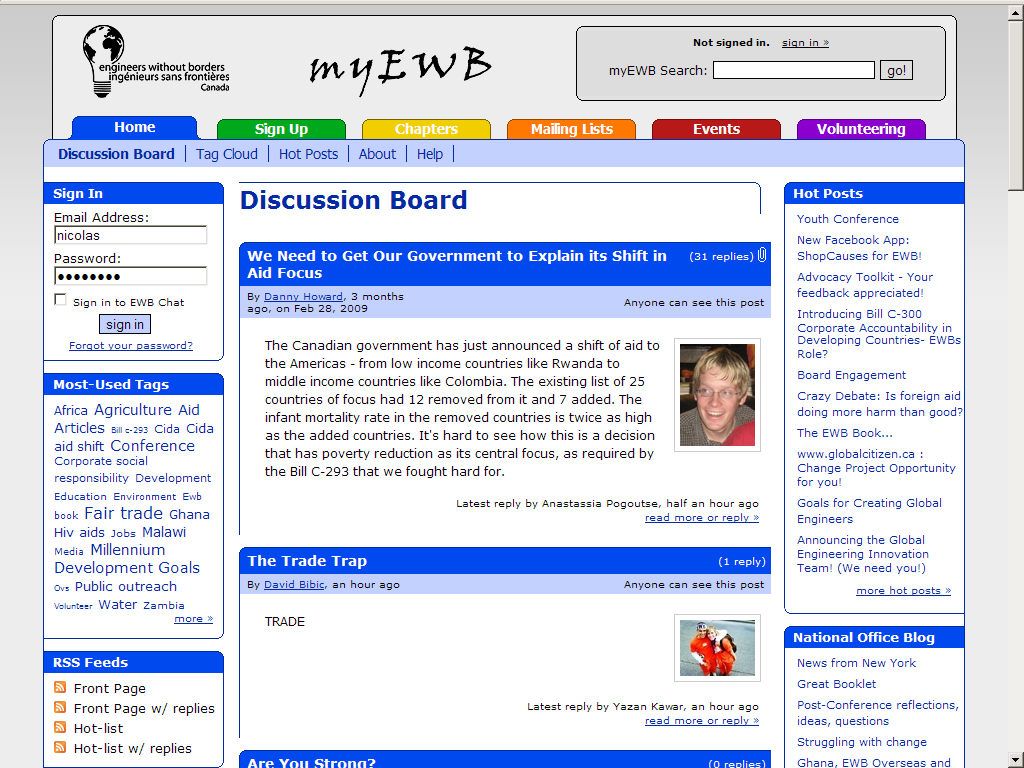
I did a 'short bit' presentation at Bitnorth 2009 about my feelings on myEWB and its history.
The presentation is available as PDF, PowerPoint and MP3.