VisMtl: Canadian MPs 2012 Visualization
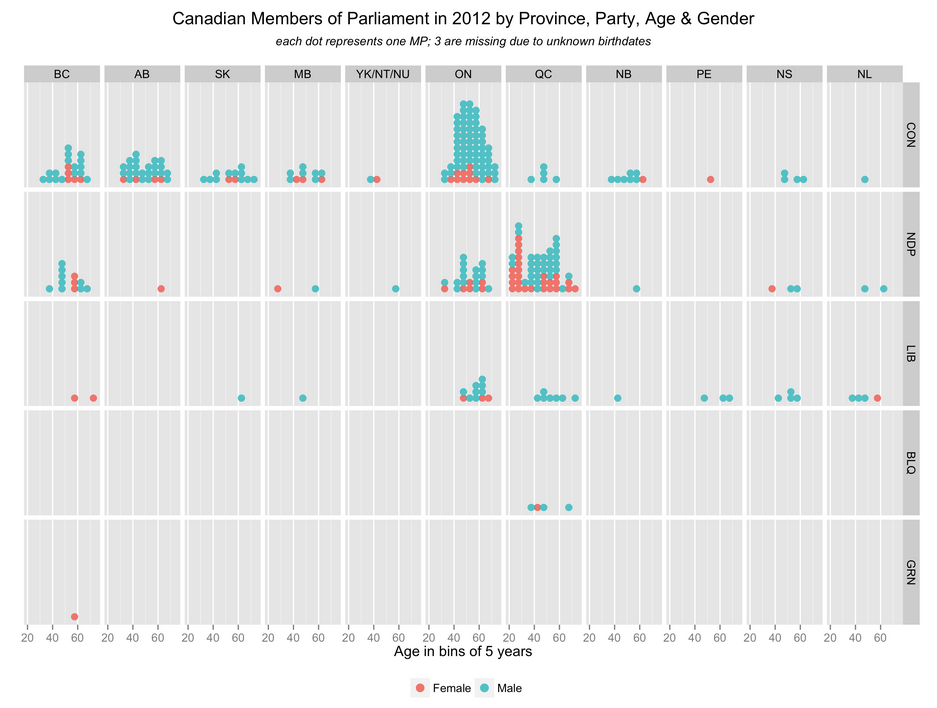
The visualization I presented at VisMtl 5 was entitled “Canadian Members of Parliament in 2012 by Province, Party, Age & Gender” and is shown above.
Key points about this visualization:
- the visualization uses small multiples of dot-plots (one per province/party combination) arranged in a 2-d lattice and represents each MP as a single dot to visually encode 4 variables:
- the vertical position of the dot-plot within the lattice encodes the MP’s party: top-to-bottom position encodes strength of party with the Conservative Government at the top, followed by the Opposition New Democrats and other two parties below
- the horizontal position of the dot-plot within the lattice encodes the MP’s province: left-to-right position roughly encodes west-to-east position of the province within Canada
- the dot’s horizontal position within the dot plot encodes the MP’s age as of 2012, and the height of the stack of dots indicates the number of MPs of that age within the dot-plot
- the dot’s colour encodes the MP’s gender
- some interesting patterns arising from the 2011 election can be seen through this visualization
- Ontario and Quebec have the most MPs, and were dominated by the Conservatives and New Democrats, respectively
- the Conservatives formed the Government due to their strength in the Prairies and the New Democratic caucus suddenly became dominated by Quebeckers
- the “Orange Crush” of New Democrats elected in Quebec comprised a disproportinally large number of women in their twenties, and this gave the NDP the best gender parity among the major parties as well as made it the only party with MPs in their twenties
- the Liberals suffered a serious defeat but still managed to get MPs elected in almost every province
- the Bloc Québecois remained a (much-dimished) Quebec-only party and the Greens finally got an MP elected in BC (their party leader Elizabeth May)
- the dataset used is one that I put together myself in October 2012 using OpenRefine and data from the Parliament website (MP names, parties and provinces) and Wikipedia (MP birthdates and genders) in order to create demos for my PivotTable.js visualization software
- although there are 308 MPs in the House, the visualization contains only 305 as I was unable to obtain birthdates for 3 MPs
- this visualization was made using the fantastic ggplot2 plotting system and the 20 lines of code required to replicate it (as well as the dataset) are available on Github at the link below.
⁂
Follow Nicolas
Code on Github
Code from this post is up on Github at nicolaskruchten/vismtl5
More Data Visualization
© Nicolas Kruchten 2010-2026