Dot Map of 2013 Montreal Election Results
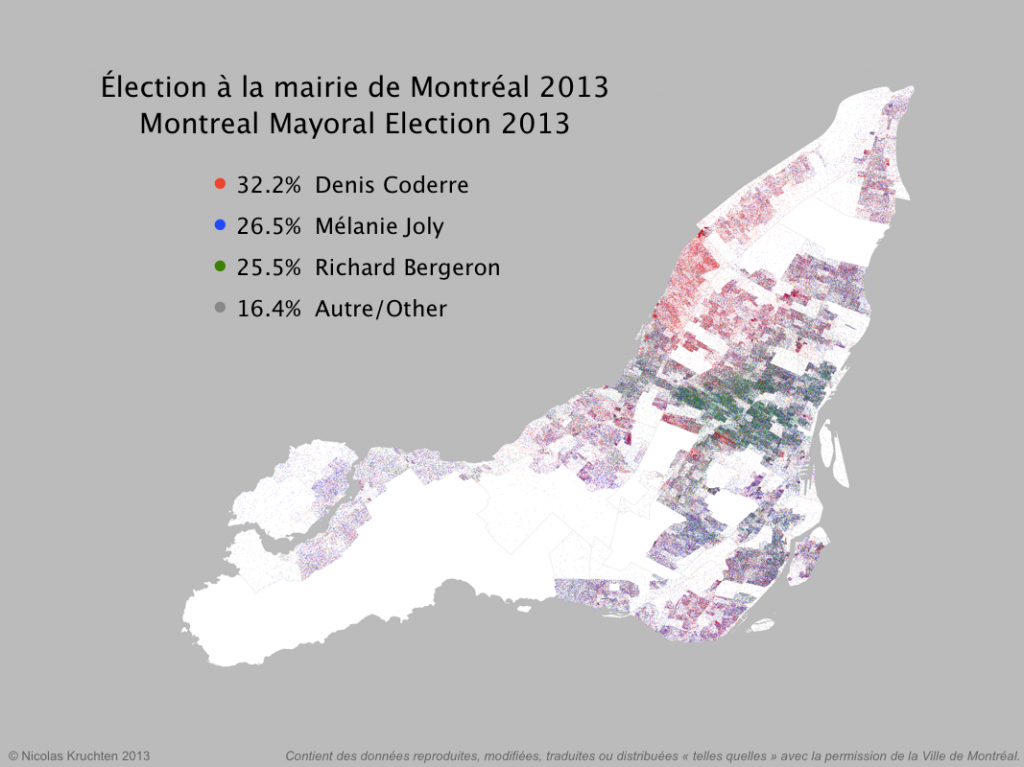
I was inspired by some cool "dot map" visualization projects around the internet (North American Census Dotmap, Toronto Visible Minorities Dot Map) to create a similar visualization of the results for the recent Montreal municipal election. I leveraged data from the Montreal Open Data portal to create the map above. There are coloured dots for (almost) each vote for the mayoralty for the top three candidates, randomly located within the catchment area for the polling booth it came from. What I like about this map is that it shows the results in all their messiness rather than neatly colour-coding entire neighbourhoods like a choropleth map would. People live and vote in arbitrary-looking clusters, not in neat blocks!
You can check out the full zommable version, and the code is available on GitHub.
⁂
Follow Nicolas
Code on Github
Code from this post is up on Github at nicolaskruchten/mtlelectiondotmap2013