Graphing Silvia Temperature on iPad
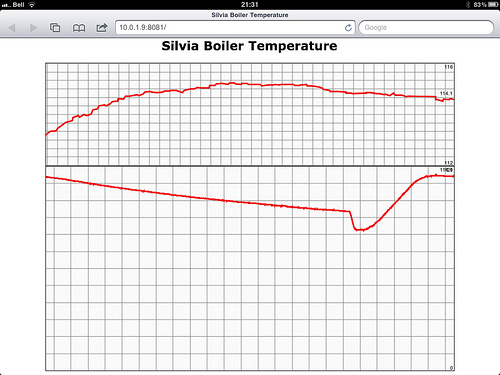
So I finally got around to working on my Silvia Mod Plan, getting all the way to Step 5! The video above is a demo of the setup I have to show a real-time graph on my iPad of the boiler temperature in the Silvia.
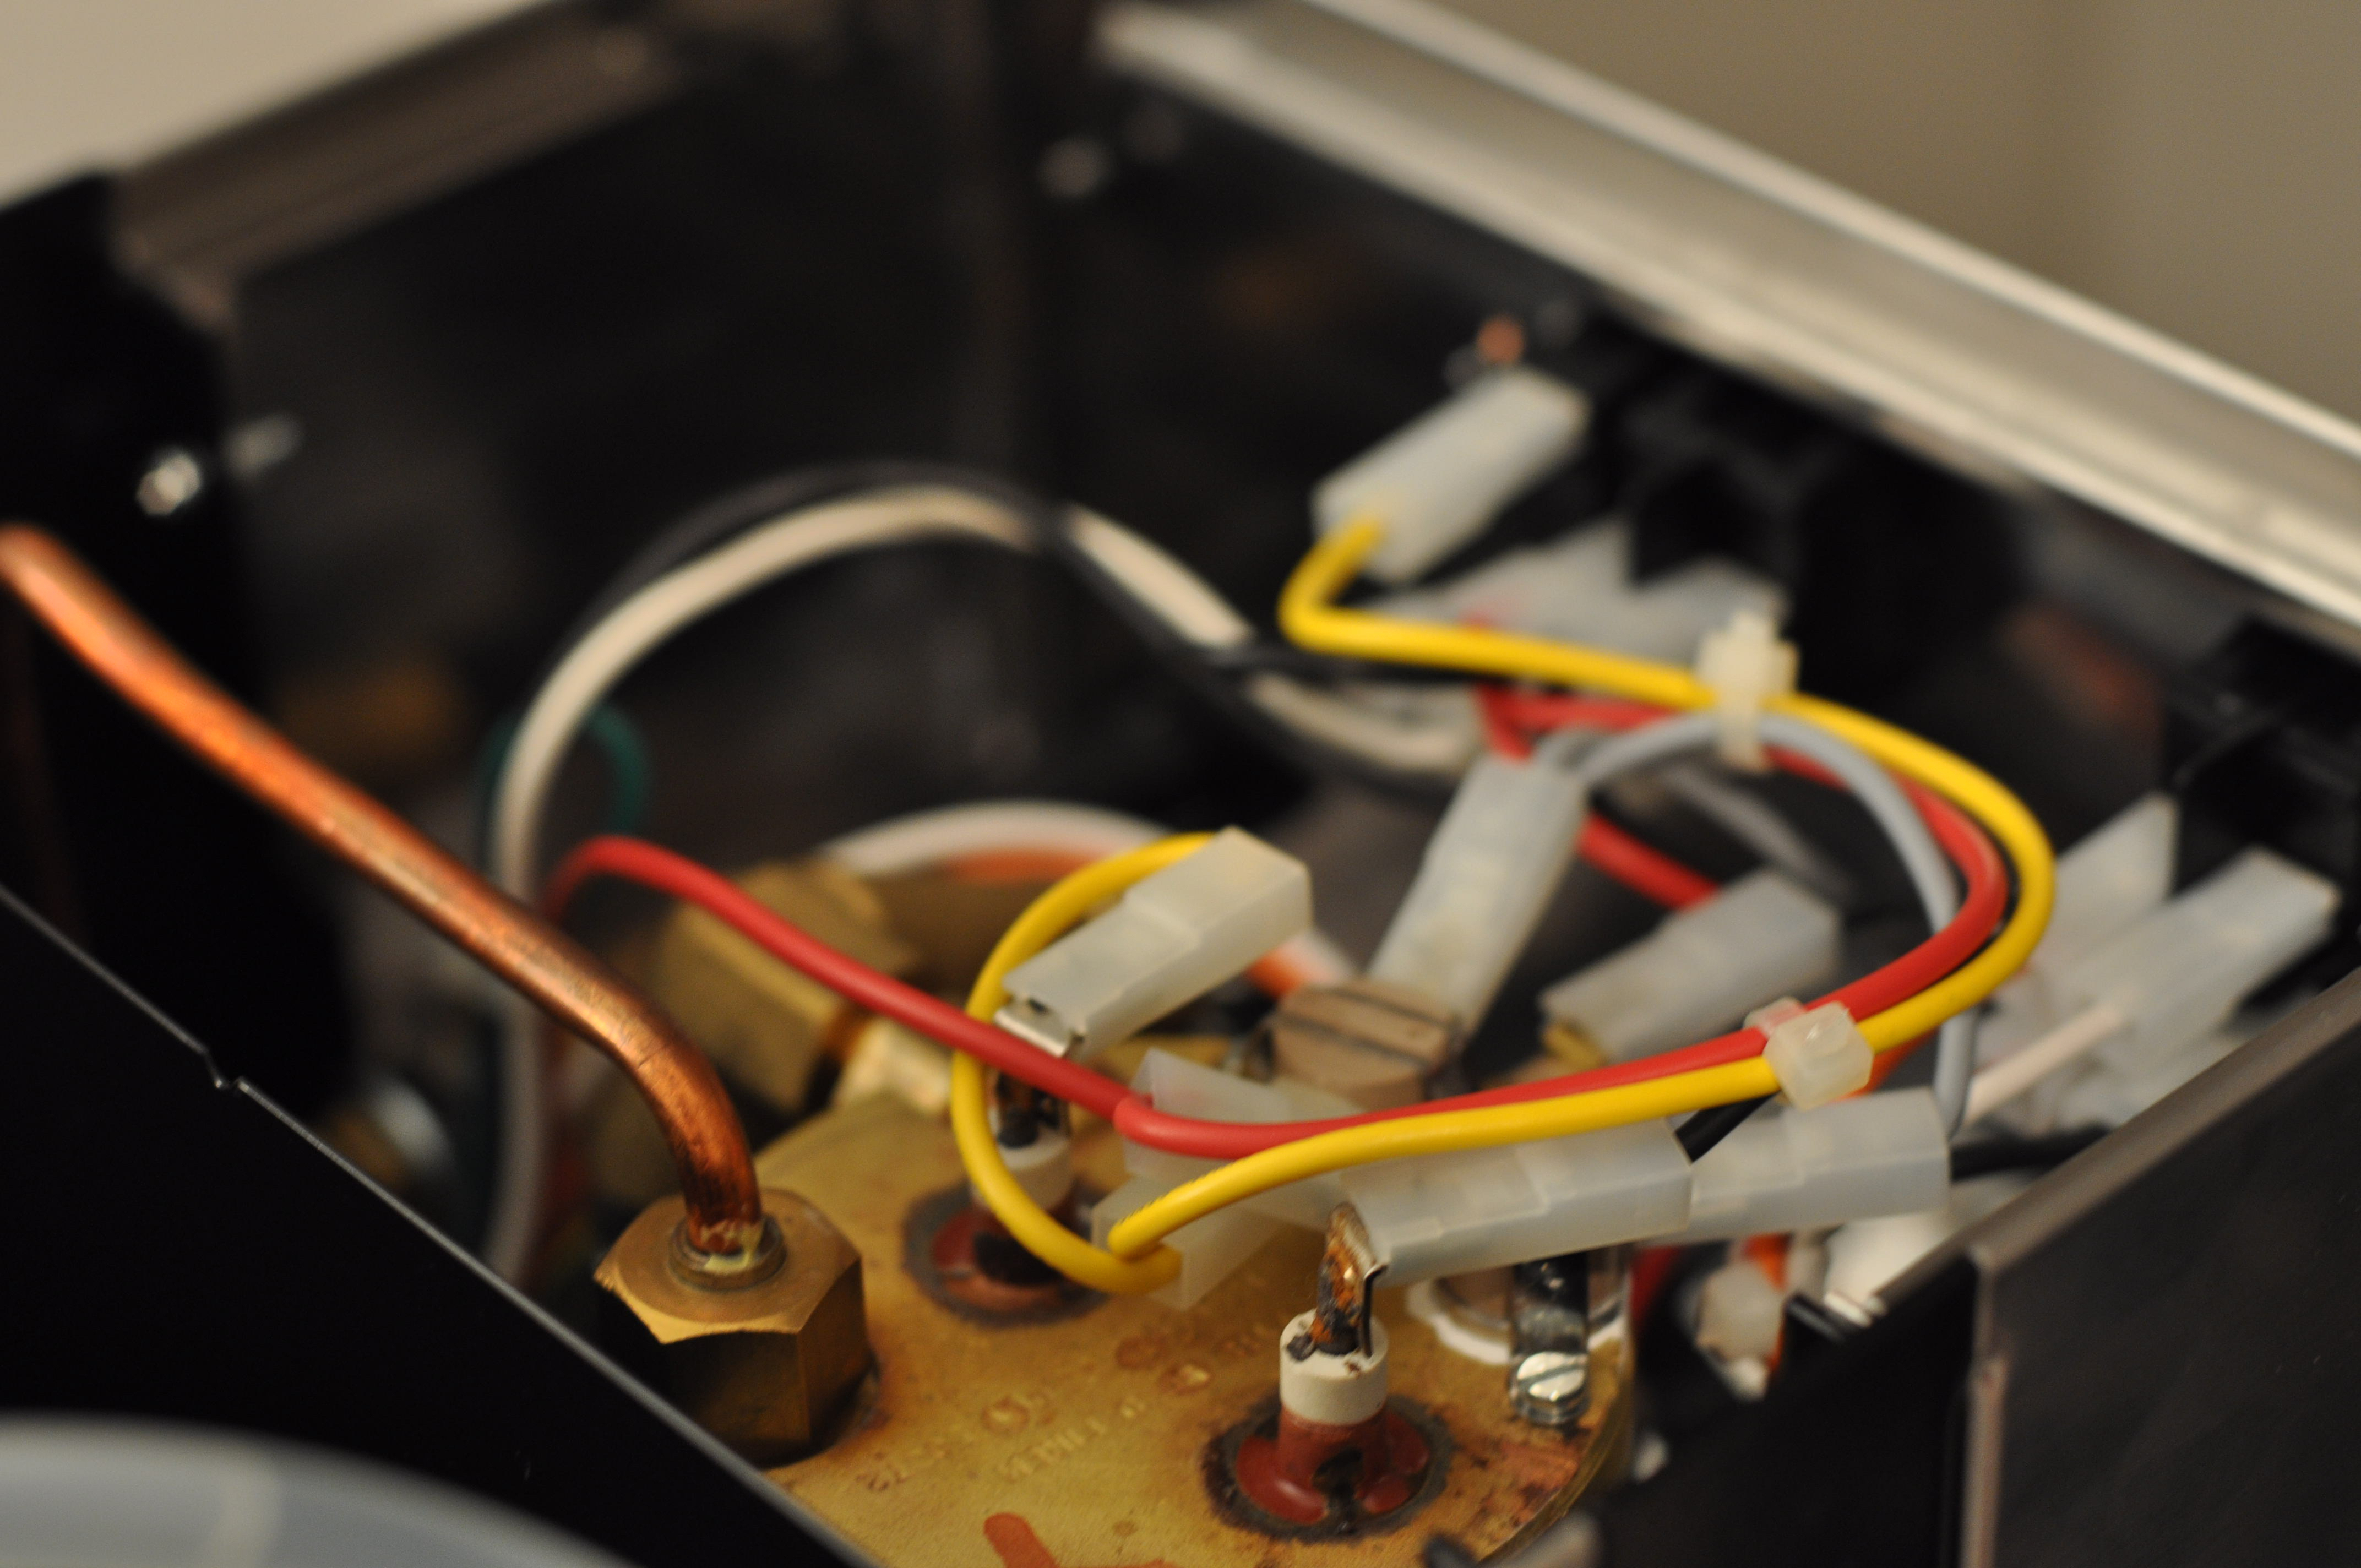
Having installed the thermocouple in the Silvia and played with my TC4 shield, my initial plan was to use the Arduino to transmit data to my iMac using XBee as a wireless serial link, where I would run a NodeJS process which would read data from the USB port and which would communicate with the iPad via a WebSocket over Wifi (phew, mouthful!). Ideally the Arduino would speak Wifi but in the meantime I figured I'd play with this setup. I chose NodeJS because it seemed really easy to set up WebSockets using socket.io, and that seemed like a good way to feed data to Smoothie Charts for real-time graphing. I rewrote the code in CoffeeScript, because it's the best way to write NodeJS code IMO (a discovery I made after writing the first version of this code 4 months ago) and because it's so fitting for this project!
The first snag I ran into was the fact that there doesn't seem to be a good way to read from a USB port from Node, and it felt too much like my day-job to write an add-on in C++ to do it, so I had to work around. My solution was to run a separate Python process which would read data from the USB port and would POST to the NodeJS web server whenever the Arduino sent a temperature reading.
The second snag I ran into was the fact that the XBee didn't seem to be able to transmit all the way to my iMac, so I hung the XBee from my laptop, located halfway between the iMac and the Silvia and ran the Python script there, POSTing over Wifi to the iMac. Then I smartened up and installed the NodeJS process on my laptop. So really, this system is just a convoluted way of doing what could have been done using a USB cable to graph data on my laptop, but bouncing signals around over multiple protocols, machines and wireless technologies is so much more fun!
The code is, of course, up on Github: https://github.com/nicolaskruchten/coffeegraph
⁂