hackMTL Inbox Social Network Visualization
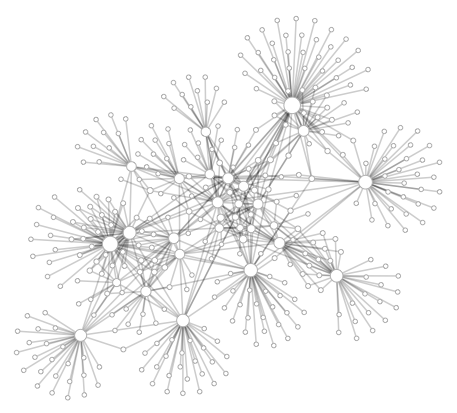
On Saturday I attended hackMTL, a one-day hackfest/competition. The ground rules called for creating an app using at least one of a list of API's. The one that caught my eye was the DokDok API (now Context.io), which basically gives you programatic read access to your GMail inbox via HTTP/JSON. Since June or so I've been doing more and more visualization of data that I work with (first at Bell then at Recoset) so I figured I'd see if I could make an app that could make a neat picture of my social network, as it's represented in my inbox. I didn't quite finish an "app" per se during hackMTL but I did manage to make a pretty picture (above). The code is up on GitHub, and basically it's a Python script that creates a JSON file which is rendered using Protovis. The circles/graph nodes represent email addresses (aka people) and the links between nodes indicate that the two parties were on the same GMail thread.
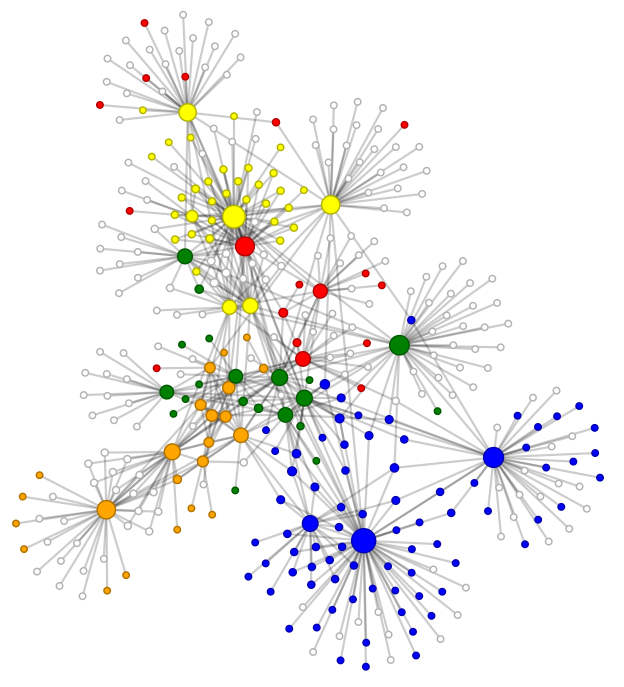
After the competition was over, back at home, I manually applied some colours to the graph above to create the graph below, based on a loose intuitive sense of the various social networks I'm a part of (yellow is Vancouver people, red is Montreal, orange is Family, blue is EWB and green is Toronto). So the visualization nicely clusters what I consider to be my social networks, and the overlaps roughly correspond to people who co-exist in multiple spheres (Vancouver friends who moved to TO or Montreal, EWB friends who live in Toronto etc).
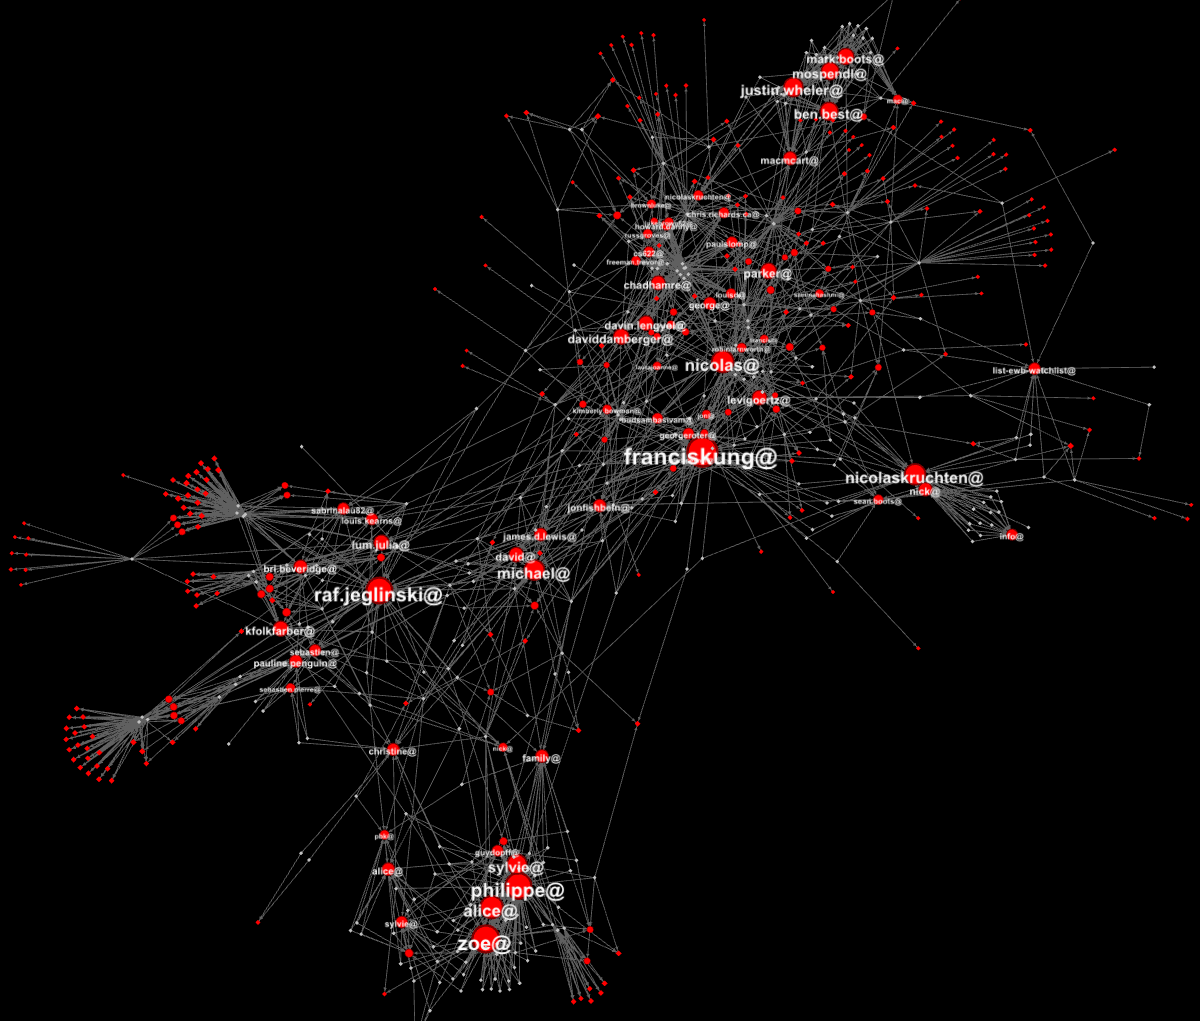
Upon looking at the data some more, however, it dawned on me that I shouldn't treat GMail threads as edges between nodes but rather as nodes in their own right. Basically a thread that multiple people participate in kind of represents a very temporary community that all the participants are linked to. I ran with this idea using Gephi, an industrial-strength graph analysis tool, given that I was no longer shackled by the competition's "app" focus, and made the graph below. I didn't manually colour this one given the number of nodes but basically red circles are people and grey dots are threads. The various clusters of people in my life are much more easily distinguishable in this graph, and really matches well with my intuition about the structure of the networks I'm a part of. My EWB network stretches from the center up and to the right. Bottom middle is my family. The left-hand side is basically high-school and Montreal friends (some of whom in fact are also friends with each other), and the cluster in the middle is non-EWB university friends.
So that's what came out of my hackMTL efforts. Lessons learned:
- email is messy: the same people have many addresses which breaks up the network structure
- people blast emails to huge lists all the time, which obscures finer details, so lots of filtering was required
- crawling a social graph takes a long time and many requests, and two strategies can help: caching and not doing depth-first search but rather keeping a 'hit list' of most-commonly-seen addresses to crawl next
- The DokDok guys are really friendly, and their tech is awesome
- graphviz is terrible at this sort of thing, Protovis is better, but Gephi is awesome
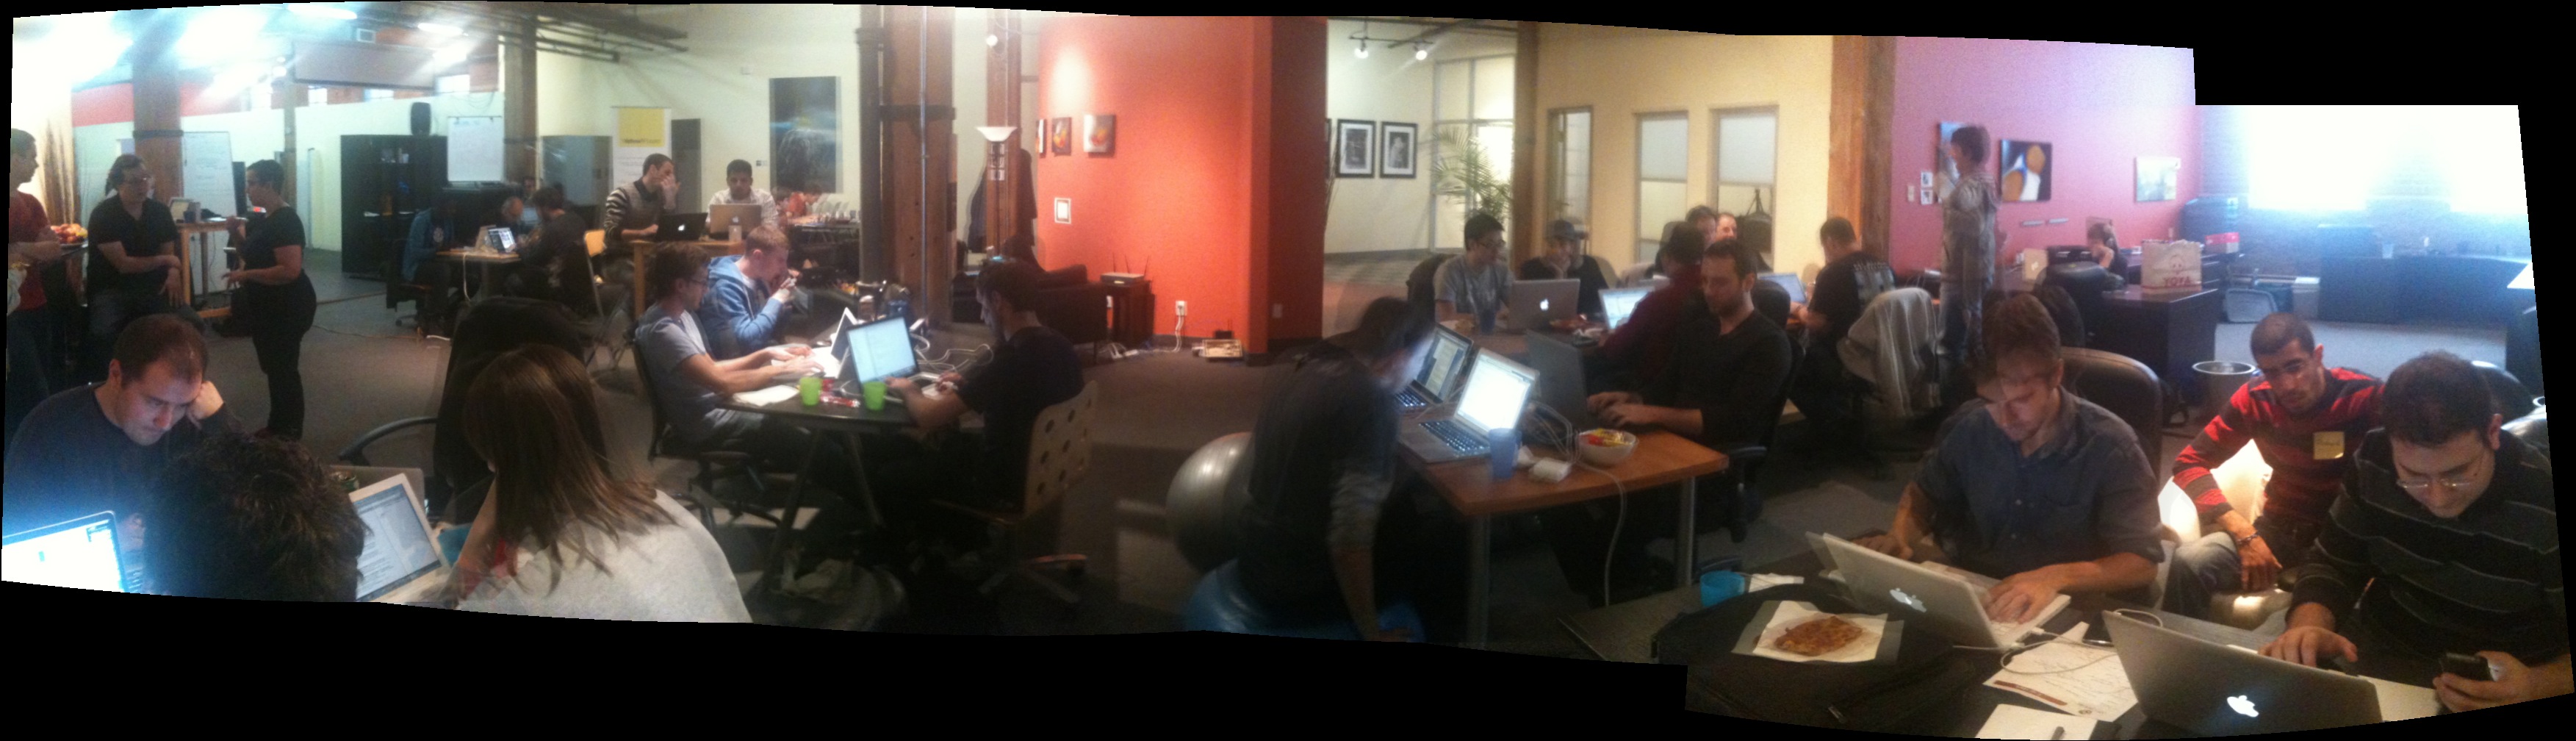
Here's what RPM Montreal looked like during the day:
⁂
Follow Nicolas
Code on Github
Code from this post is up on Github at nicolaskruchten/hackMTL