
Nicolas Kruchten
is a data visualization specialist
based in Montreal, Canada.
Visualizing Family Trees
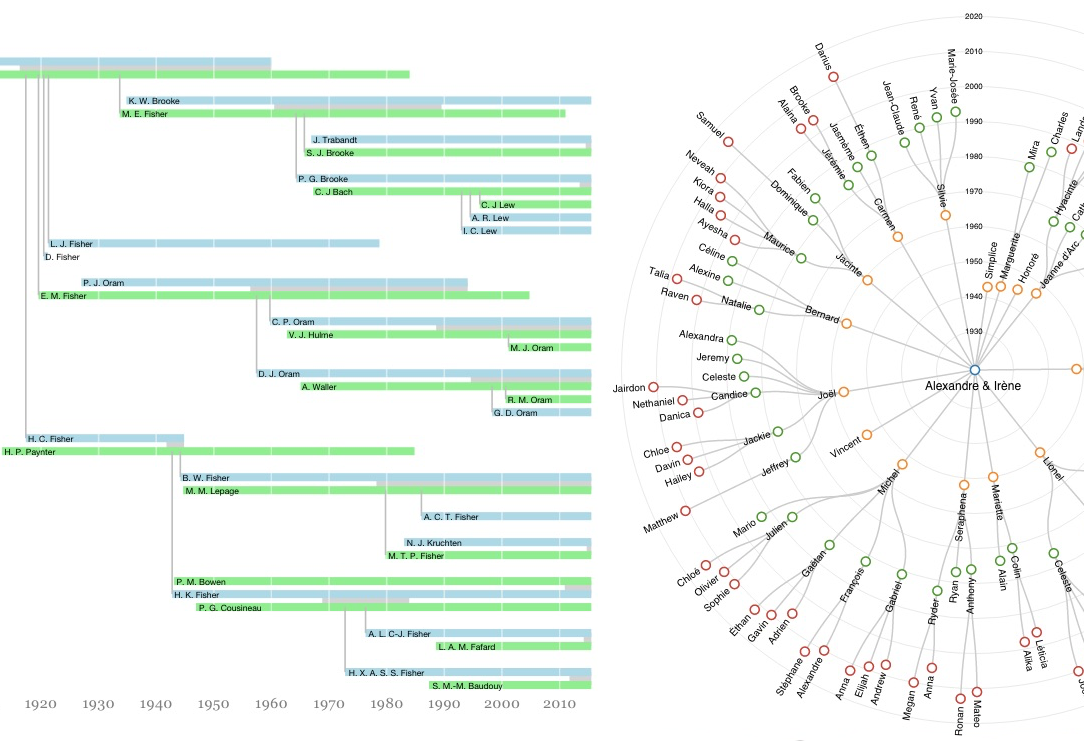
I had the pleasure of visiting with many members of my wife’s family this summer, some of whom are genealogy enthusiasts. I made a pair of visualizations of the data they had collected: one in the run-up to a family reunion and one to find my way around the large family we visited in Saskatchewan.
RoboWar
I learned to program in the late nineties through a game called RoboWar. RoboWar provides a simulated arena in which two virtual robots try to destroy each other by running a program written by their respective players. The goal was to create a robot which could win a tournament, which were held about twice a year; entrants would email their creation to someone with a fast computer who would simulate hundreds of battles and then let everyone know who had won and make the entries public.
MTL Data: Montreal 311 Service Requests, an Analysis
Earlier this year, I collaborated with a reporter from the Montreal Gazette to analyze a dataset containing information about 1.4 million service requests received by the City of Montreal from its citizens. The resulting article was entitled "Montreal's 311 records shed light on residents' concerns — to a point" and credits me at the bottom. I have also published my own interactive analysis of the dataset here: Montreal 311 Service Requests, an Analysis. The dataset, obtained from the city's Gestion des demandes clients (GDC) system via an Access to Information request, covered the five years from 2008 to 2012 and contained the date and a very short description for each request, and in most cases, an address. The service requests were received by the city through its 311 phone line or at service counters throughout the city.
Montreal Python: Introducing the Machine Learning Database
I recently did the first ever public demo of the product I'm working on at Datacratic: the Machine Learning Database.
House Numbers on the Island of Montreal
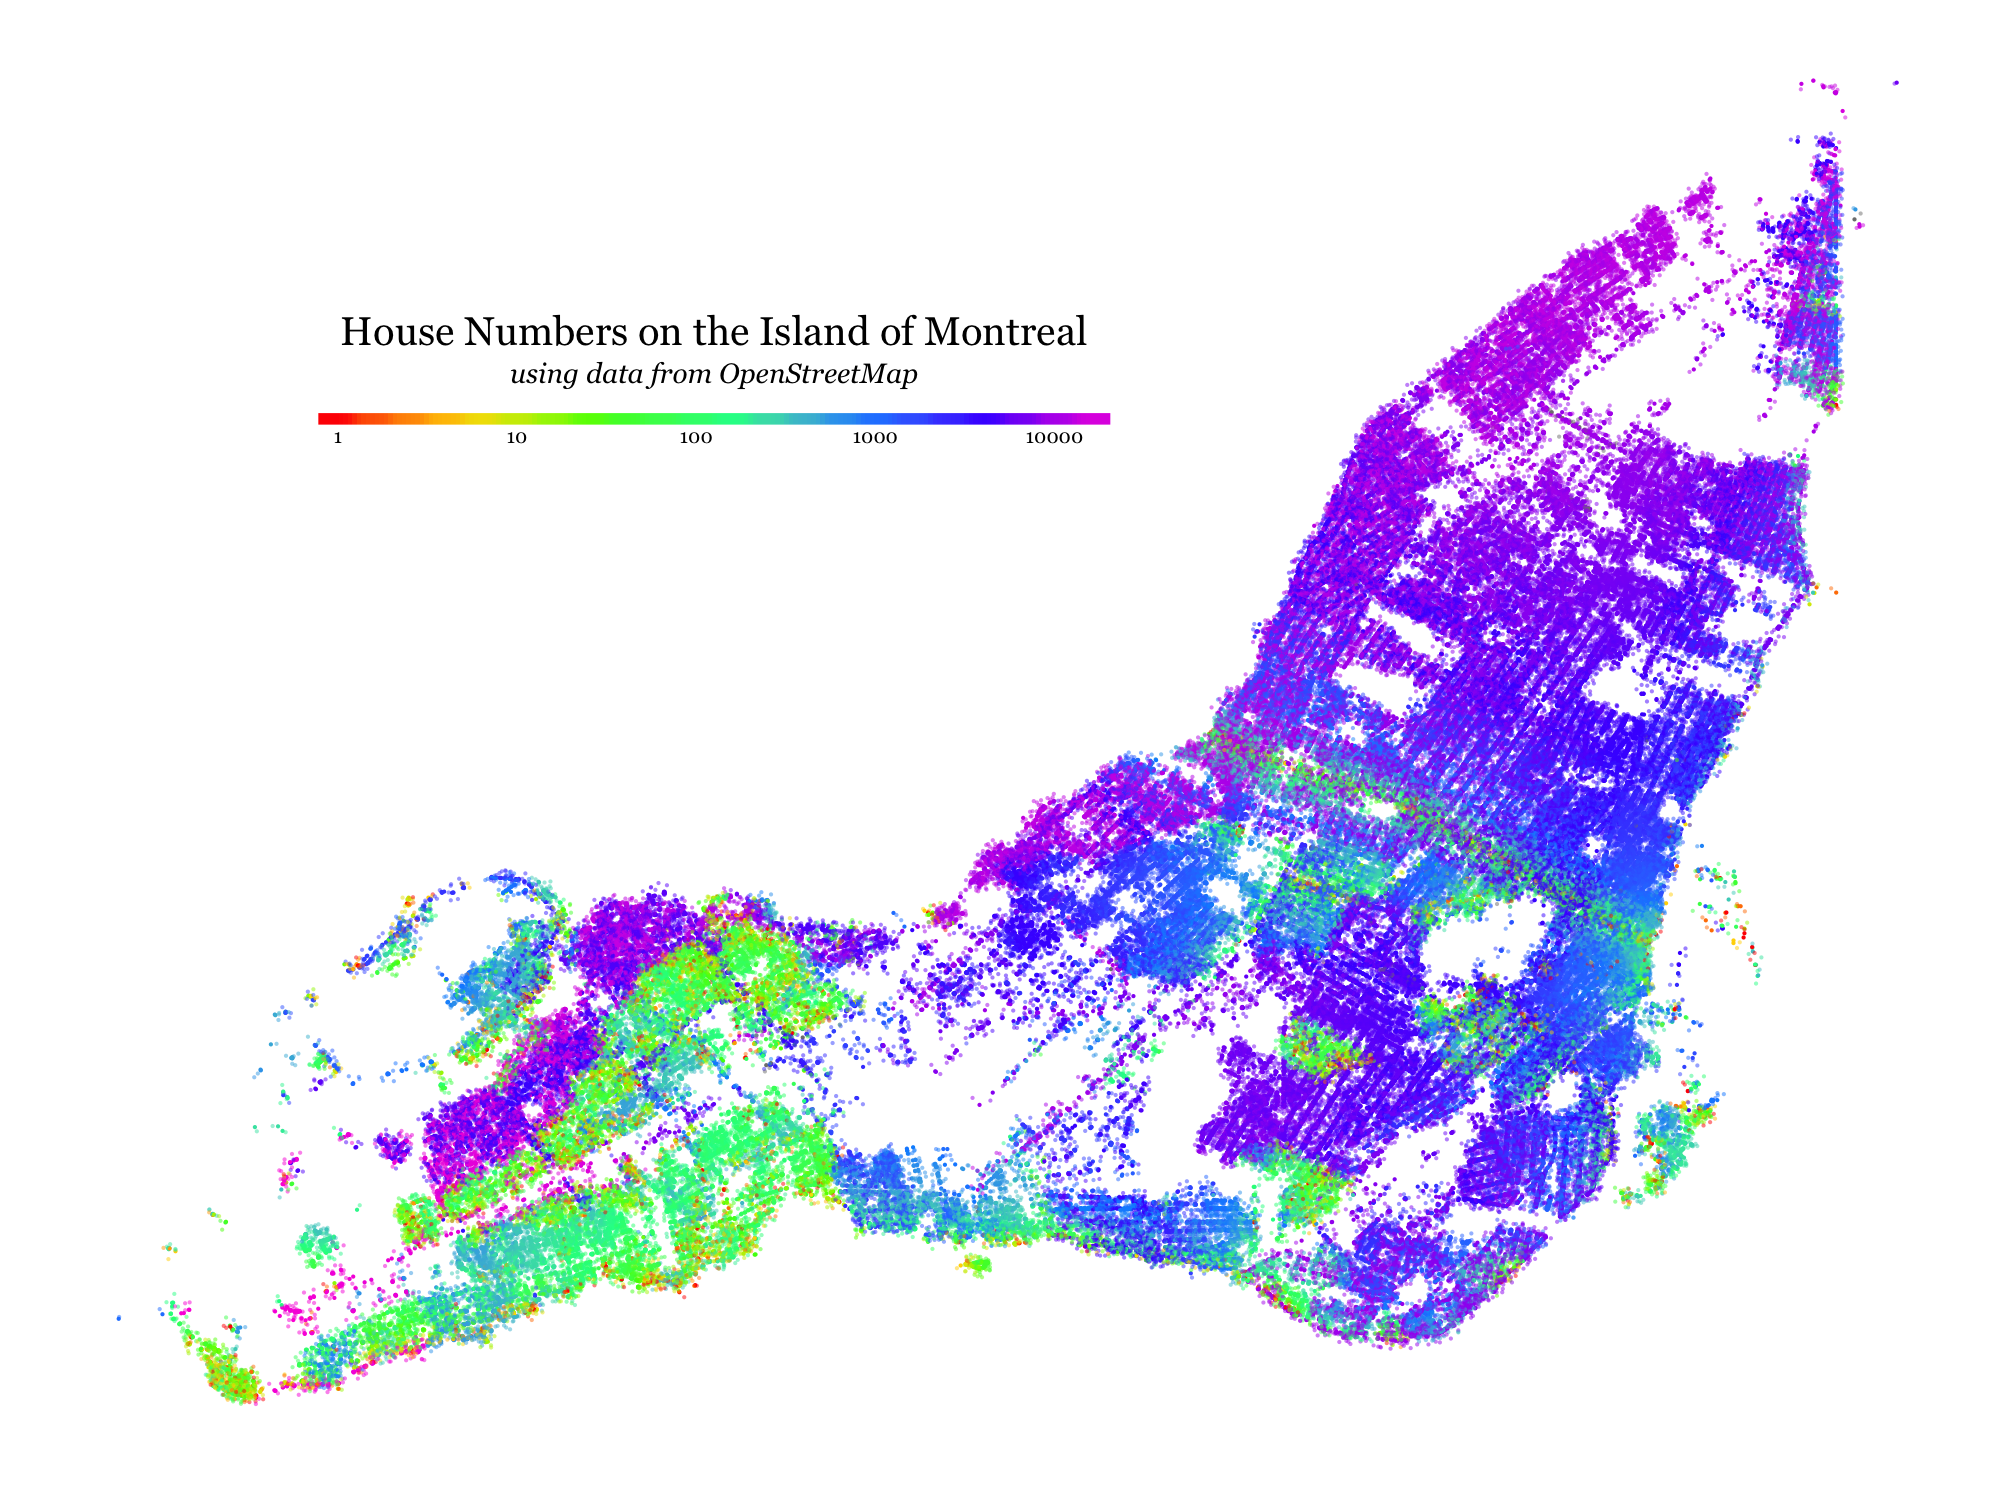
I’ve always been curious to see what kinds of patterns would be visible if one tried to visualize the distribution of house numbers (the number in a street address) across a city like Montreal. This week I took some time to learn enough about the OpenStreetMap system to gather and plot the data.
VisMtl #5 Roundup

I recently organized and MC’ed the fifth Visualization Montreal meetup, and I think it was a great success! The concept was to have a series of 7-minutes-max flash presentations from Montrealers where each one would show off a single visualization project. The rules were: no slides, no tools, just one publicly available data visualization. We had 12 presenters including me, with a good mix of types of data and visualizations. Below is the list of visualizations that were presented, and you can find photos of the event here.
VisMtl: Canadian MPs 2012 Visualization
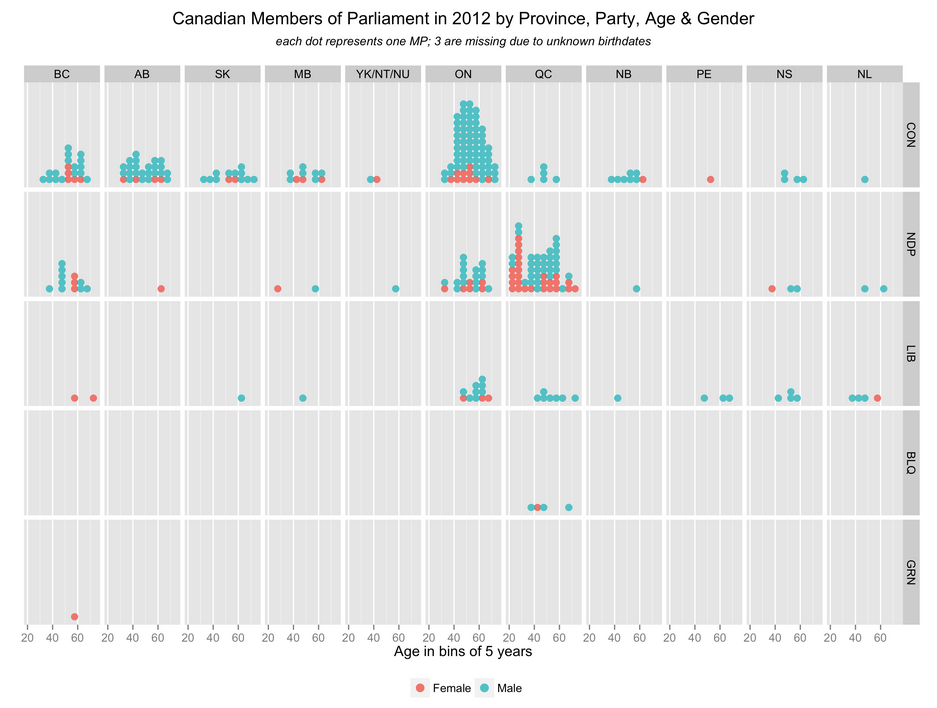
The visualization I presented at VisMtl 5 was entitled “Canadian Members of Parliament in 2012 by Province, Party, Age & Gender” and is shown above.
The Programmatic Waterfall Mystery: Solved
A recent article on AdExchanger asks “In the supposedly super-efficient world of RTB, why would publishers continue to waterfall their demand sources?”. The article goes on to say that the publisher’s justification is “Because it works” but that “Any economist could tell you that this is a bad idea”. I’m not an economist but I can still pull together enough auction theory to show that this practice isn’t necessarily a bad one today.
PAPIs.io 2014: Behind the scenes with a Predictive API
I gave a talk at in Barcelona at the PAPIs.io 2014 Predictive APIs conference last November.
Interactive Subreddit Map with t-SNE
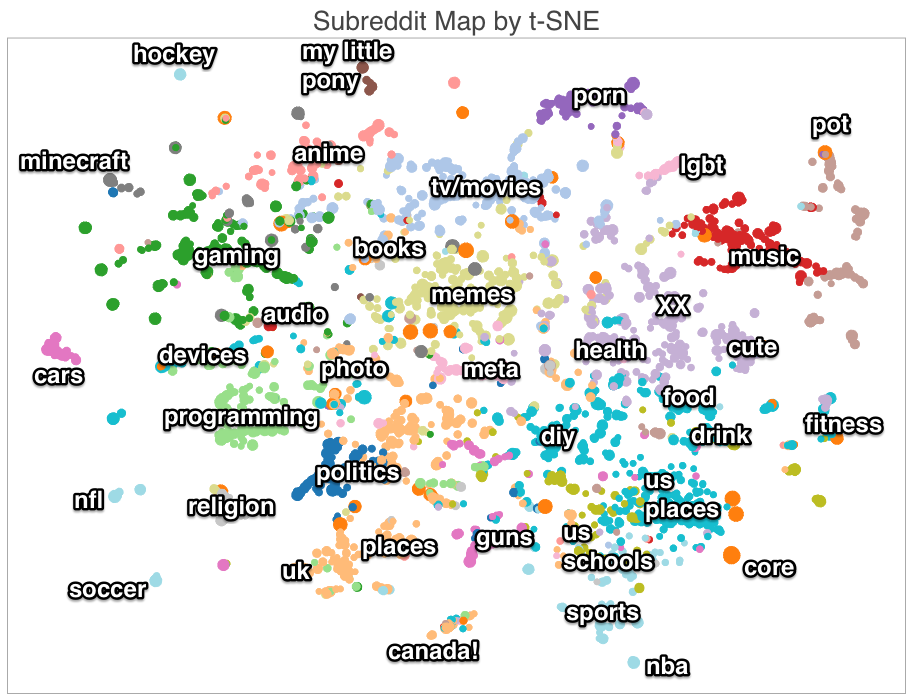
For part of my presentation at Montreal Python, I made an interactive map of the various sub-sections of the website Reddit (called subreddits). You can take a look at the interactive version or see a static annotated one above. The interactive one includes basic info on how I made it and full details are in the presentation. I got some nice comments in the /r/DataIsBeautiful subreddit post